MVP Cameron Fuller Presenting at SysCTR MN User Group

This month the Minnesota System Center User Group will have System Center MVP  Cameron Fuller presenting "Monitoring and tuning System Center with SCOM".  For those of you not familiar with Cameron, he is a Operations Manager Most Valuable Professional (MVP).  A Principal consultant for Catapult Systems, an IT consulting company and Microsoft Gold Certified Partner. … Read more

Cireson SM Outlook Console and new Veeam MP Released

  This is an exciting week for System Center! Today Cireson has released the SCSM Outlook Console. This tool lets you work with Service Manager from Outlook. Here is what you can do with it: create, view, edit, and complete incidents, changes requests, problems, activities, and service requests. Here is a link to it on … Read more

Integration points for System Center SP1

Microsoft recently update the Integration points for System Center map for Service Pack 1. The map is a diagram that illustrates the integration points between all the technologies in the System Center stack. Here is what the map looks like:   This can be downloaded here: http://www.microsoft.com/en-us/download/details.aspx?id=36429

DPM as a Distributed Application in SCOM

In Operations Manager 2012 there is something known as a Distributed Application (DA). The purpose of a DA is to give you the overall health of an application made up of different multiple objects. DA’s pull in objects that are already being monitored by SCOM. An example of using a DA could be to provide the health of a web application that consists of backend databases and front end web servers. Both the backend databases and front end web servers are objects that are monitored separately but together make up the entirety of the web application. Monitoring these alone lets you know what the health is of each object but when one of the objects is in a critical state it does not always help put two and two together that these objects make up the components of the web application.

When an infrastructure has multiple DPM servers a DA can be used to get an overall health of your DPM as a service vs… the health of each DPM server through state views trying to track down the root issue. We are going to create a new name for our multiple DPM servers. We need to do this because multiple DPM’s brought together in a DA become a service. We are going to call this "DPM Service". DPM as a DA can be useful for quick spot checking of your DPM service health. Using a DA also allows you to connect relationships between the health of objects that make up DPM. For example you can see the health of disks in the DPM storage pool, tape libraries, SQL databases, protected servers and the DPM servers.

In this post I am going to cover setting up DPM as a DA using the Distributed Application Designer (DAD) and show what it looks like after DPM is a DA. There are a few items that need to be covered before you can setup DPM as a DA. These are:

  • You need to have DPM Central Console installed in SCOM.
  • All DPM servers that will be a part of your DA DPM Service will need to have the SCOM agent installed.
  • Create a custom management pack to store your new DA in SCOM.

Setting up a DPM DA using the Distributed Application Designer

In the SCOM console go to: Authoring.

Right click on Distributed Applications and select Create new distributed application.

The Distributed Application Designer (DAD) will open.

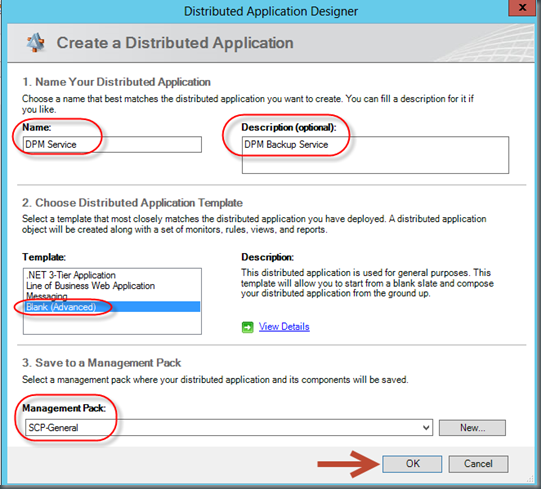
Enter in the information about your DPM Service.

The fields you will need are highlighted in the following screenshot.
clip_image001

In the Template box, select the template for the starting point of the distributed application. Chose Blank (Advanced).

Choosing advanced is going to give us a blank template to work from and this is what we want.

Select your custom management pack that you made for this DA and click OK.

Now we need to create a couple of component groups. Let’s create the following:

  • Databases
  • Servers

Read more

SCOM: Heartbeat Failure Alert Tuning

I recently deployed SCOM in a highly distributed network. Most of the edge locations had slow WAN links. These edge locations would often go offline. With the combination of the slow WAN links and them going offline SCOM would flood with alerts/emails on Health Service Heartbeat Failure and Computer Not Reachable monitors.

This had to be tuned out because these alerts were overwhelming for the team. Also as soon as these edge locations would go offline the team would be notified through other network location monitoring tools and from the staff at these edge locations.

These edge locations would often go offline for reasons of power outages or ISP’s going down. These edge locations could also be down for long periods from 2-3 days at a time. Fixing the issues were often out of the control of the team. Receiving alerts during these outages from the edge locations was not helpful. The team still needed alerts right away if servers at the corporate locations went offline. There are several ways to tune alerts for these monitors.

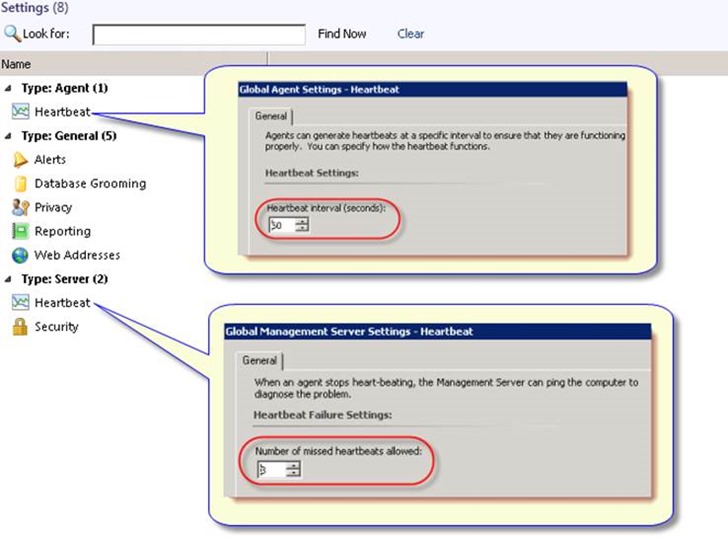
One way to tune Health Service Heartbeat Failure and Computer Not Reachable monitors is to adjust the heartbeat interval (default is 60 seconds) and the amount of missed heartbeats SCOM will tolerate. Note this would be a global change in SCOM across all monitored servers. To access these settings do the following:

In the SCOM console go to Administration>>Settings  in the right hand pane under Type: Agent you will see Heartbeat. Right click on Heartbeat and open the properties.  In the same pane under Type: Server you will see another Heartbeat. Right click on Heartbeat and open the properties. You can see this in the following screenshot:

clip_image001

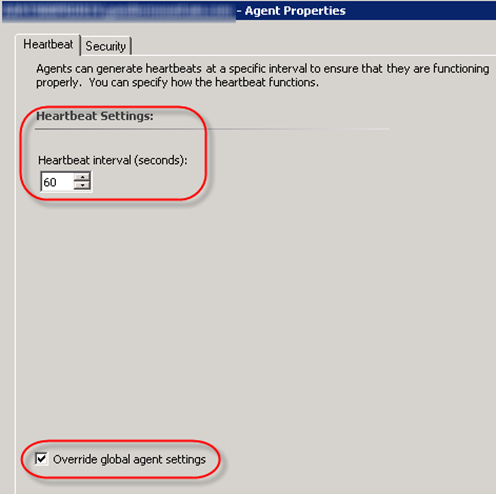
Another way to tune the alerts on these monitors would be to go adjust the heartbeat interval on an individual server level. This would only be useful if you have a small amount of servers generating these alerts and know what servers they are. To access these settings in the SCOM console go to Administration>>Settings>>Agent Managed. Find your server/s. Right click on the server and select properties. Under the Heartbeat tab select the checkbox next to Override global agent settings and then adjust the Heartbeat interval.

clip_image002

For more information about both of those visit:

Heartbeat and Heartbeat Failure Settings in Operations Manager 2007

http://technet.microsoft.com/en-us/library/cc540380.aspx

Neither of those helped in my situation because we needed these alerts right away from one group of servers but not from another. Here is what I did to tune these monitors so that the team would not become overwhelmed by the alerts.

In this particular environment there were some things I need to point out before I go into the solution.

  • The team did not want to monitor heartbeat or ping basically connectivity to the edge servers at all. They were more interested in gathering performance data, status of the applications on those servers and more.
  • The servers that live in the edge had different sequence in the computer name vs. the servers that lived in the corporate locations. The naming schema was structured like this:
    • Corporate location # 1 server names: PROD100-xxV or PROD100-xxP.
    • Corporate location # 2 server names: PROD200-xxV or PROD200-xxP.
    • Edge server names: PROD404-xxV or PROD404-xxP (404 would actually match the number of that edge location. This would vary from edge to edge.).

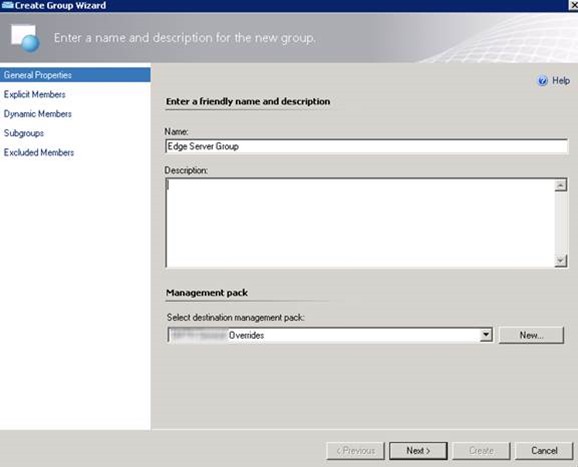
The name schema was a big helping in breaking things out. So I basically created an edge server group in SCOM dynamically excluding all corporate locations. Here is what it looked like to build this:

clip_image003

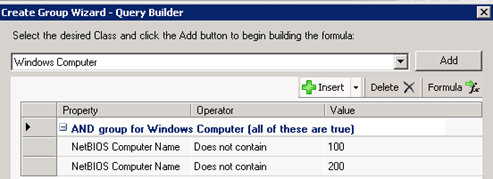
Building the logic:

clip_image004

What it looks like in the group:

clip_image005

By doing that the members would consist of all servers from all edge locations without including any servers from corporate locations.  This member list was built dynamically so that the team did not ever have to worry about adding edge servers to the membership.

Read more