Monitoring Azure Kubernetes Service (AKS) with Azure Monitor & Log Analytics

Part of running Kubernetes is being able to monitoring the cluster, the nodes, and the workloads running in it. Running production workloads regardless of PaaS, VM’s, or containers requires a solid level of reliability. Azure Kubernetes Service comes with monitoring provided from Azure bundled with the semi-managed service. Kubernetes also has built in monitoring that can also be utilized.

It is important to note that AKS is a free service and Microsoft aims to achieve at least 99.5% availability for the Kubernetes API server on the master node side.

But due to AKS being a free service Microsoft does not carry an SLA on the Kubernetes cluster service itself. Microsoft does provide an SLA for the availability of the underlying nodes in the cluster via the Azure Virtual Machines SLA. Without an official SLA for the Kubernetes cluster service it becomes even more critical to understand your deployment and have the right monitoring tooling and plan in place so when an issue arises the DevOps or CloudOps team can address, investigate, and resolve any issues with the cluster.

The monitoring service included with AKS gives you monitoring from two perspectives including the first one being directly from an AKS cluster and the second one being all AKS clusters in a subscription. The monitoring looks at two key areas “Health status” and “Performance charts” and consists of:

Insights – Monitoring for the Kubernetes cluster and containers.

Metrics – Metric based cluster and pod charts.

Log Analytics – K8s and Container logs viewing and search.

Azure Monitor

Azure Monitor has a containers section. Here is where you will find a health summary across all clusters in a subscription including ACS. You also will see how many nodes and system/user pods a cluster has and if there are any health issues with the a node or pod. If you click on a cluster from here it will bring you to the Insights section on the AKS cluster itself.

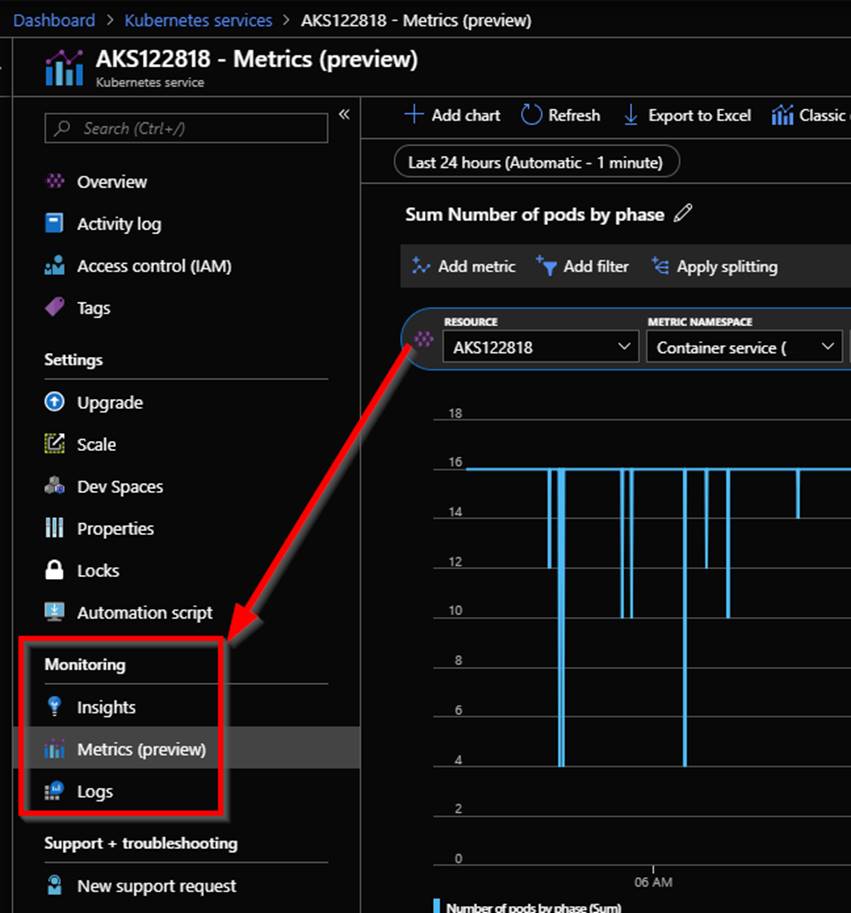
If you click on an AKS cluster you will be brought to the Insights section of AKS monitoring on the actual AKS cluster. From here you can access the Metrics section and the Logs section as well as shown in the following screenshot.

Insights

Insights is where you will find the bulk of useful data when it comes to monitoring AKS. Within Insights you have these 4 areas Cluster, Nodes, Controllers, and Containers. Let’s take a deeper look into each of the 4 areas.

Cluster

The cluster page contains charts with key performance metrics for your AKS clusters health. It has performance charts for your node count with status, pod count with status, along with aggregated node memory and CPU utilization across the cluster. In here you can change the date range and add filters to scope down to specific information you want to see.

Nodes

After clicking on the nodes tab you will see the nodes running in your AKS cluster along with uptime, amount of pods on the node, CPU usage, memory working set, and memory RSS. You can click on the arrow next to a node to expand it displaying the pods that are running on it.

What you will notice is that when you click on a node, or pod a property pane will be shown on the right hand side with the properties of the selected object. An example of a node is shown in the following screenshot.

Controllers

Click on the Controllers tab to see the health of the clusters controllers. Again here you will see CPU usage, memory working set, and memory RSS of each controller and what is running a controller. As an example shown in the following screenshot you can see the kubernetes dashboard pod running on the kubernetes-dashboard controller.

The properties of the kubernetes dashboard pod as shown in the following screenshot gives you information like the pod name, pod status, Uid, label and more.

You can drill in to see the container the pod was deployed using.

Containers

On the Containers tab is where all the containers in the AKS cluster are displayed. An as with the other tabs you can see CPU usage, memory working set, and memory RSS. You also will see status, the pod it is part of, the node its running on, its uptime and if it has had any restarts. In the following screenshot the CPU usage metric filter is used and I am showing a containers that has restarted 71 times indicating an issue with that container.

 In the following screenshot the memory working set metric filter is shown.

You can also filter the containers that will be shown through using the searching by name filter.

You also can see a containers logs in the containers tab. To do this select a container to show its properties. Within the properties you can click on View container live logs (preview) as shown in the following screenshot or View container logs. Container log data is collected every three minutes. STDOUT and STDERR is the log output from each Docker container that is sent to Log Analytics.

Kube-system is not currently collected and sent to Log Analytics. If you are not familiar with Docker logs more information on STDOUT and STDERR can be found on this Docker logging article here:  https://docs.docker.com/config/containers/logging.

Read more

Microsoft Professional Program for DevOps Finished!

I am a firm believer that no matter how old you are, how far along you are in your career, and regardless of the industry you are in it is important to continue educating yourself. This helps you expand your skillset, stay relevant, and sets you up for new opportunities as they come along. My field of information technology has been changing at a rapid pace and so for a while, I wanted a good way to ramp up on DevOps as a whole. A while back I found out that Microsoft added a new track to their Professional Program for DevOps. When I checked it out I found it to be very thorough and it was not just focused on Microsoft’s DevOps tooling but included non-Microsoft as well. I jumped in without hesitation and started learning.

I finally completed the program last week. Here is my certificate https://academy.microsoft.com/en-us/certificates/67284e84-8afe-4f13-b477-d7620949fb18. I am planning to dive into the program they have for cloud next. If you have not heard of Microsoft’s Professional Program DevOps before here more information about it:

“DevOps is the union of people, process, and products to enable continuous delivery of value to end users. This program helps the student learn about continuous integration and deployment, infrastructure as code, testing, databases, containers, and application monitoring: skills necessary for a DevOps culture in today’s workplace. This program focuses on Microsoft DevOps technologies as well as some OSS (Open Source Software) DevOps tools. Some of the Microsoft DevOps technologies covered in this course consist of Azure, Azure Resource Manager, IaaS, PaaS, IIS, Azure App Service, DevTest labs, Desired State Configuration (DSC), Azure Automation, OMS, Application Insights, SQL, Nuget, TFS, VSTS, and Visual Studio. Some of the OSS DevOps tools covered in this course consist of Jenkins, Git, Github, New Relic, Nagios, Chef, Docker, DC/OS, swarm, and Kubernetes.”

Here is a link to it:  https://academy.microsoft.com/en-us/tracks/devops

This program consists of 8 required courses. Each course runs for three months and starts at the beginning of a quarter. In the end, there is a capstone that has to be completed. This capstone course is the 8th one. You have four weeks to complete the capstone. The capstone is a bunch of hands-on stuff you have to do. Courses average 16-32 hours per course to complete and are taken via the edX.org platform https://www.edx.org/microsoft-professional-program-devops.

Here is a list of all of the DevOps program courses:

      • Introduction to Dev Ops Practices
      • Infrastructure as Code
      • Continuous Integration and Continuous Deployment
      • Configuration Management for Containerized Delivery
      • DevOps Testing
      • DevOps for Databases
      • Application Monitoring and Feedback Loops
      • Microsoft Professional DevOps Capstone Project
      • The DevOps Capstone Project contains:
        • Automation
          • Use ARM templates to deploy and configure Infrastructure in Azure
        • Continuous Integration
          • Implement Continuous Integration solution using Visual Studio Team services (VSTS)
        • Continuous deployment
          • Implement Continuous Deployment solution using Visual Studio Team Services (VSTS)
        • Testing
          • Implement Unit tests
          • Implement Testing in Production
        • Application Monitoring
          • Implement application monitoring solution using Application Insights

As you can see from that list this program is not just all about VSTS. There is a lot of Azure baked in as well as other non-Microsoft DevOps tooling. I highly recommend this course for anyone jumping into DevOps, or CloudOps and especially for folks with an IT pro background. If CloudOps is foreign to you here are a couple of blogs related to this topic: Sys Admin to Cloud Admin…ITSM to CloudOps…On-Prem to Azure Stack/Azure and Native Cloud Management in Azure.

My personal opinion is that Microsoft should move away from the certifications as they are and to this format. This format combines training and testing. When Microsoft first started the Professional Program for they only had a track for data scientists. They have added more and more tracks over time. Today there are tracks also for Big Data, Web Development, Software Development, AI, IT Support, and Cloud Administration.

Here is a link for all the tracks so you can check them out: https://academy.microsoft.com/en-us/professional-program/tracks. These programs are a great way to expand your learning. Check them out!

Read more

Monitoring Azure PaaS

I recently had the opportunity to present at the annual SCOM/OMS Day held by the MN System Center user group. Here is a link to the past event https://mnscug.org/meetings/499-october-2017-mnscug-meeting. Other presenters during this event included Microsoft MVP Cameron Fuller, Microsoft MVP Bob Corenelissen, and Nathan Foreman, another Minnesota local. I chose to present on Monitoring Azure PaaS. In this blog post I will cover the information from my presentation and dive deeper into the topic.

Defining PaaS

Before you can monitor something you need a full understanding of what it is that you will be monitoring. Let’s start out by clarifying what PaaS is. There are many facets to cloud and the services that are available in cloud. You also can utilize public cloud, run your own private cloud or utilize a combination of the two known as hybrid cloud. Regardless if you have public, private, or hybrid cloud you can leverage Infrastructure as a Service (IaaS), Platform as a Service, and Software as a Service.  Below is an image that has been around for a while that visually explains the main differences between running your own data centers and utilizing cloud.
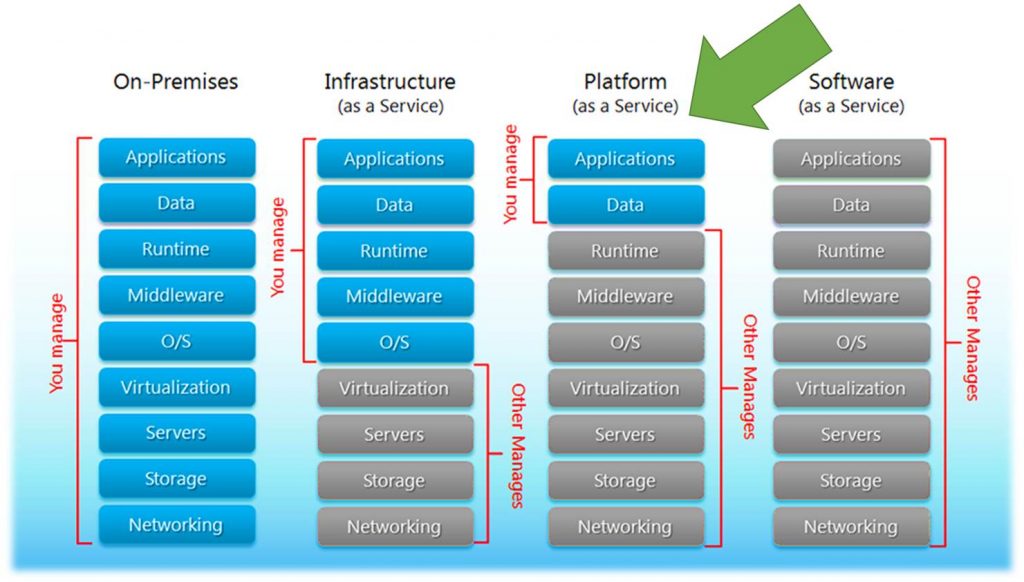
After viewing the previous image lets dive a little bit deeper into what it is explaining. When you run your own data center/s you are responsible for EVERYTHING all the way down to the networking and storage including monitoring all of that. As you move to the cloud you reduce your administrative overhead releasing that to the cloud vendor.

Most organizations first foray into cloud is to utilize IaaS. With IaaS you take a lift and shift approach of essentially running your existing servers and or new servers in cloud as virtual machines. At this layer you no longer have to worry about and manage the hypervisor, servers, physical storage, and physical networking. At the IaaS layer you still need to manage and monitor what is running on the servers that power workload and applications consisting of things like the OS, middleware, data and the applications. You also manage and monitor software defined storage and networking.

As organizations move to PaaS in cloud you release even more to the cloud vendor reducing even more administrative overhead. Also with PaaS the cost of the cloud services decreases. With PaaS you are responsible for the applications and data. You no longer need to worry about maintaining the administrative tasks of the applications, middleware or the OS.

Examples of some Azure PaaS services are Web Apps, Mobile Apps, API Apps, Media Services, CDN, Search, Event Hubs, Notification Hubs, Service Bus, Batch service, Azure AD, B2B/B2C, Azure DNS, Storage, SQL/MySQL/Postgres databases, CosmosDB, Service Fabric, IoT, Azure Functions, Logic Apps, Azure Container Service, Redis Cache, HD Insight, Key Vault, Azure Bot service, and much more.

Let’s zero in on SQL as a service in the cloud. With traditional SQL you had to properly scope and size the server properly, ensure you have enough storage space, split data, logs etc. After that you would need to plan and make SQL highly available, tune a SQL server for performance, maintain it and more. With PaaS the majority of this goes away. In fact with PaaS there is no SQL server/s to manage anymore. With PaaS when developers or anyone in IT need a SQL database they simply go spin it up. IT can still put controls in place such as policy and governance standards that are essentially boundaries that the consumer of the service needs to stay within however it is all self-service.

Now even though SQL databases can be spun up by consumers on their own and the SQL servers are managed by the cloud vendor (Microsoft). Now you would think in a cloud PaaS model you no longer need to monitor as there is no SQL server/s to administer. This is simply not true and we will get more into the monitoring aspect more later on in this post.

Applications running in Azure are typically made up of multiple PaaS services and sometimes a PaaS service itself will have dependencies on other PaaS services. An example of this can be seen in the following Application Map.  This shows that PaaS services have many moving parts across multiple parts and can be complex.
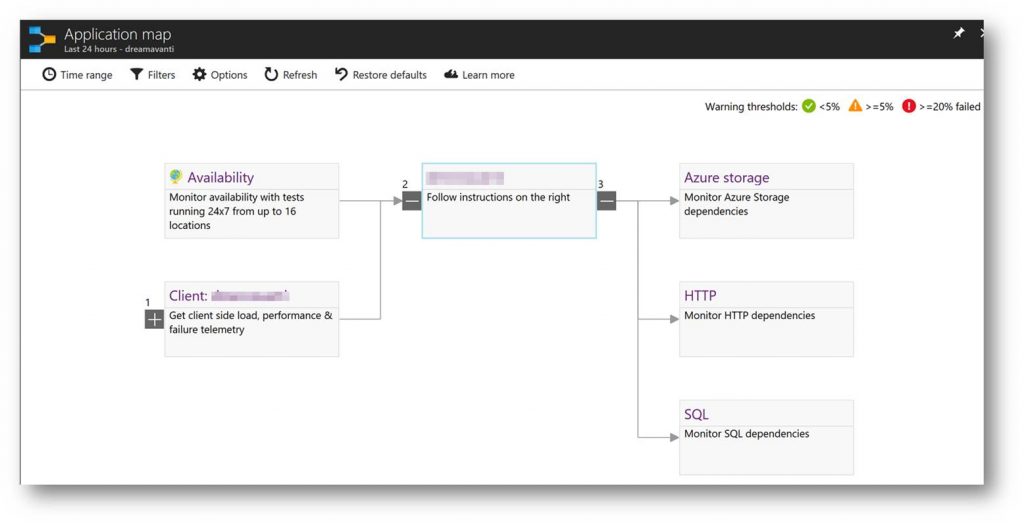
With PaaS components that make up applications it is important not to just monitor the components but also the application itself.

Why Monitor PaaS?

Most folks automatically think that they don’t need monitoring of PaaS because they assume without servers and high availability they don’t need to. This simply is not true. Below is a list of reasons of why it is important to monitor PaaS.
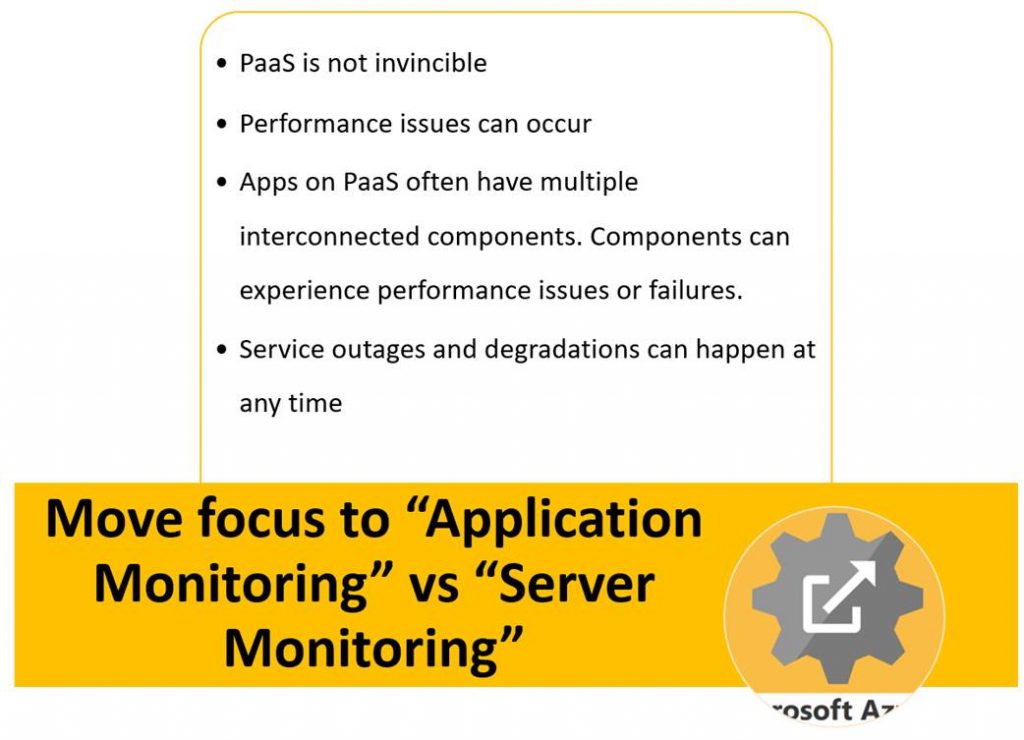
Overall when it comes to PaaS best practice is to move away from the old ways of thinking and methods for monitoring servers and on-premises infrastructure and move to a focus of monitoring the business applications.

Understanding the monitoring framework in Azure

Next up let’s take a look at the framework of monitoring in Azure. This will help you to better understand what is possible and how the monitoring tools plug into this framework. There are three main areas of data that is generated by Azure services that can be leveraged in monitoring. These sit across IaaS and PaaS services. These areas are:

  • Diagnostic
  • Logs emitted by an Azure resource that provide rich, frequent data about the operation of that resource.
  • Resource-level diagnostic logs require no agent and capture resource-specific data from the Azure platform itself.
  • Can send these to OMS Log Analytics, Event Hubs, or an Azure Storage account.

_______________________________

  • Metrics
  • Gain near real-time visibility into the performance and health of Azure workloads.
  • Performance counters are emitted by most Azure resources.

_______________________________

  • Activity Log
  • Insight into subscription-level events that have occurred in Azure.
  • Determine the ‘what, who, and when’ for any write operations (PUT, POST, DELETE) taken on an Azure resource in a subscription.
  • Categories of data: Administrative, Service Health, Alert, Autoscale, and Recommendation. (Policy, Security, and Resource Health coming…)

The types of monitoring data sit at different layers on IaaS and PaaS. On IaaS the application logs and metrics come directly out of the application. Diagnostic logging sits across the application and OS layer while metrics sit across the OS layer and VM layer. The activity logging sits at the Azure infrastructure layer.

On PaaS both the diagnostic logging and metrics come from the Azure resources directly. The activity logs again are at the Azure infrastructure layer.
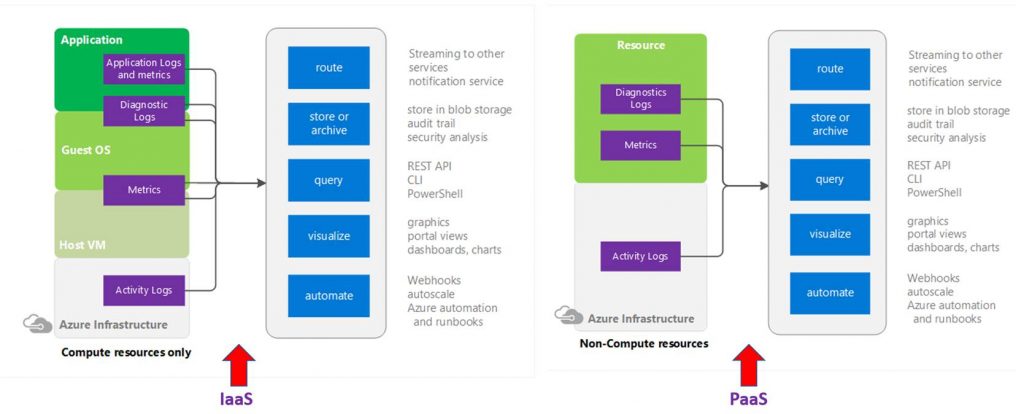
With the diagnostic logs and metrics you can access and configure these via the Azure portal, PowerShell, Azure CLI and many have API.

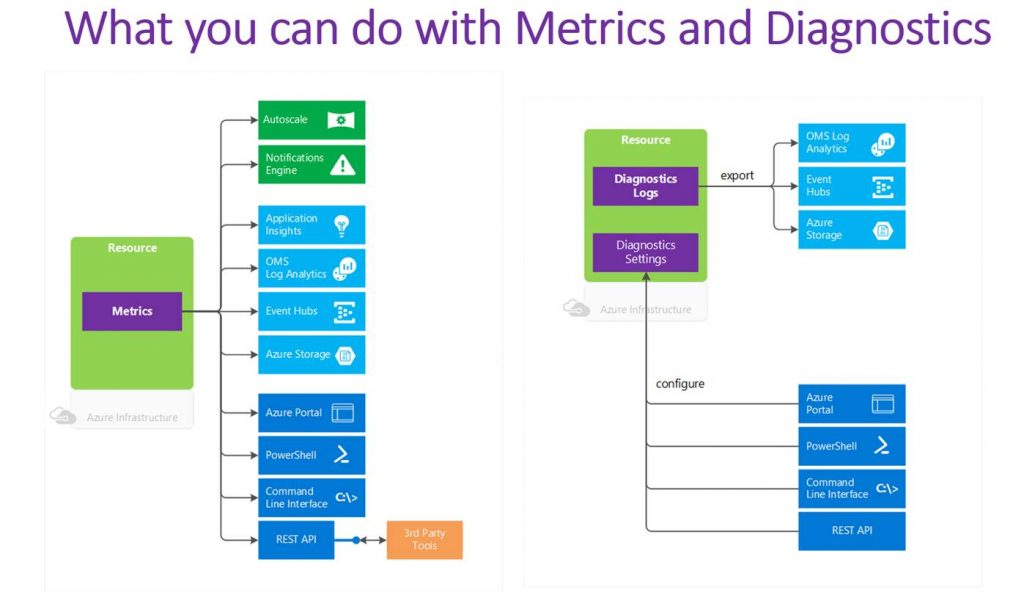
Diagnostic logs can be sent to OMS log analytics, Event Hubs or Azure storage for other consumption. Metrics can also be sent to OMS log analytics, Event Hubs, Azure storage, and Application Insights. With Metrics you can also fire off alerts and autoscale a service. Alerts can kick off emails, webhooks, and Azure Automation runbooks. The following diagrams visually breakdown what can be done with metric and diagnostic log data.
Options for monitoring Azure PaaS

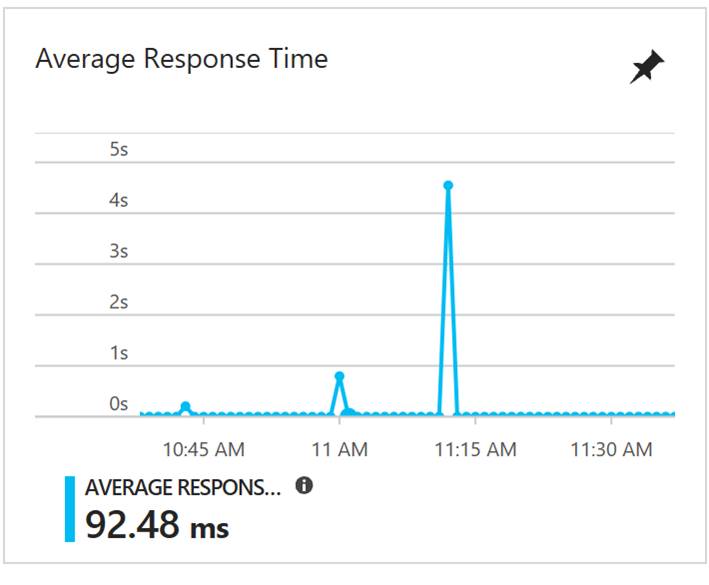
When it comes to monitoring PaaS Microsoft has many options available. There also are options available from a ton of 3rd party vendors. In this blog post I will only talk about the Microsoft options. Majority of the monitoring tools from Microsoft that can monitor PaaS are cloud based but you also can do some PaaS monitoring via System Center Operations Manager. The cloud options are much faster, easier to onboard and have been built from the ground up with cloud in mind. With Azure you also have out of the box monitoring capabilities on most of the Azure services. For example with a web app in Azure on the overview blade you can see things like data in and out and the Azure Response Time as shown in the following screenshot.
It is great that we get some monitoring out of the box for PaaS services, however this does not help when you are running hundreds+ of services. To handle enterprise scale monitoring of PaaS services you need to centralize the monitoring and that is where the monitoring solutions come in. Microsoft has 4 cloud based monitoring tools to help centralize your Azure monitoring. These tools are able to scale as needed without any hard limits. SCOM is a 5th monitoring tool that can monitor Azure. SCOM is on-premises only though. Here is a screenshot of the various tools minus SCOM:

Here is an example custom PaaS monitoring dashboard in Azure combining widgets from the various monitoring tools:
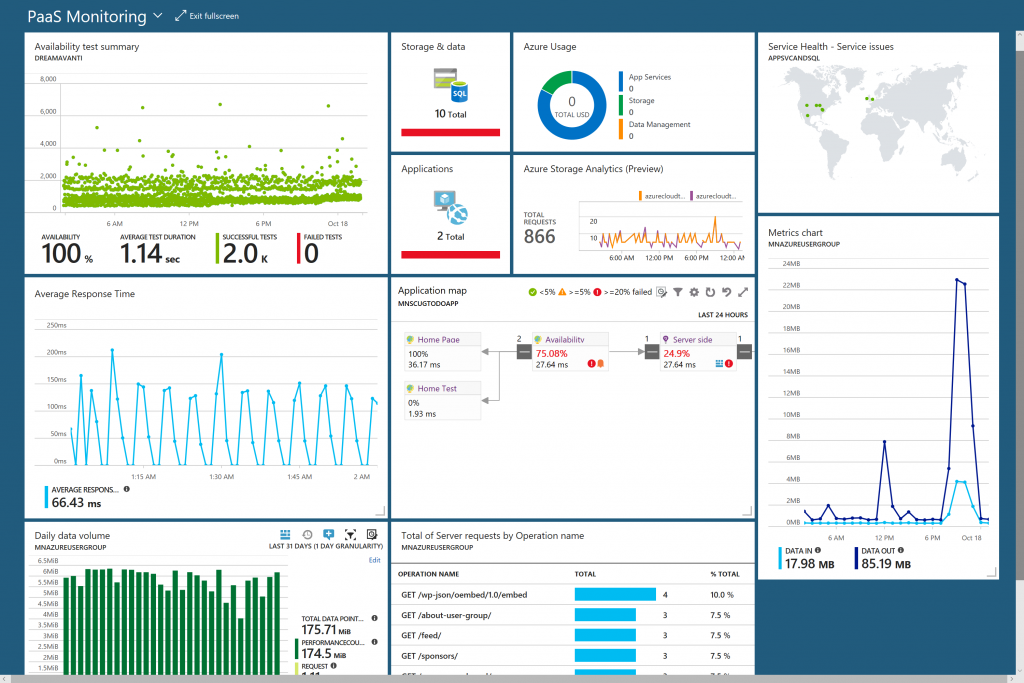
Now let’s dive into what each tool is and an example of when and how you would use them to help monitor Azure PaaS services.

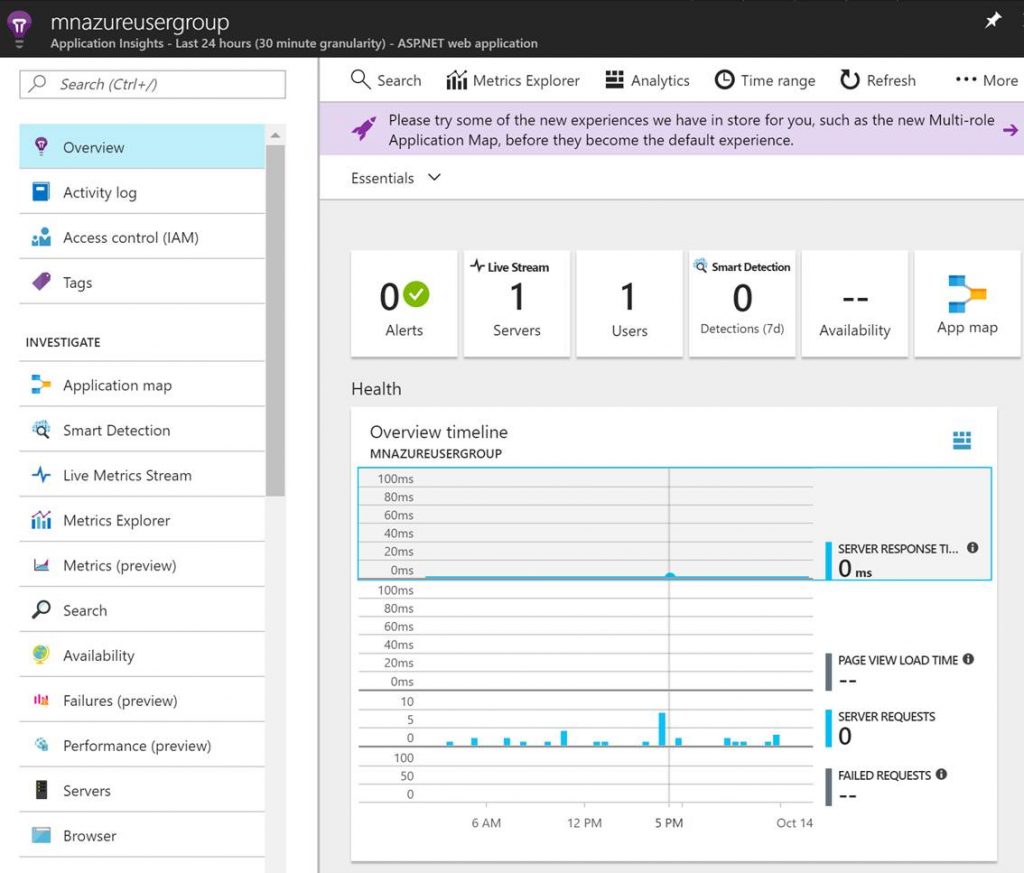
Application Insights is a Application Performance Monitoring (APM) solution used to monitor applications all the way down to the code. Application Insights is typically used for web apps and other Azure PaaS services to detect, triage, and diagnose the root cause of issues. Application Insights gives you the ability to monitor many things about your applications such as availability, metrics like data coming in and out, dependency mappings through application map, performance data, and even live streams of data points. The following screenshot is an example of a web app in Application Insights.
The following screenshot is an example of an availability test summary chart in Application Insights. It is a ping test pointed to a URL. It gives you the % of the apps availability, the successful tests and failures.
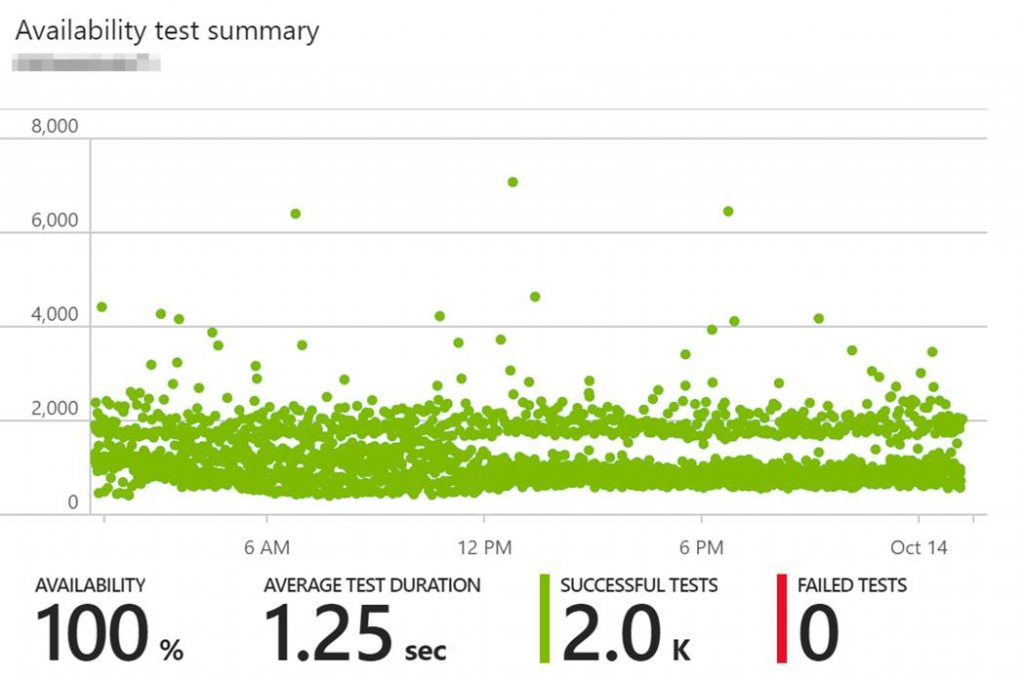
With the availability ping test you have control over a bunch of options such as the frequency, success criteria, any needed alerts upon failures, and the ability to select the locations the test runs from.
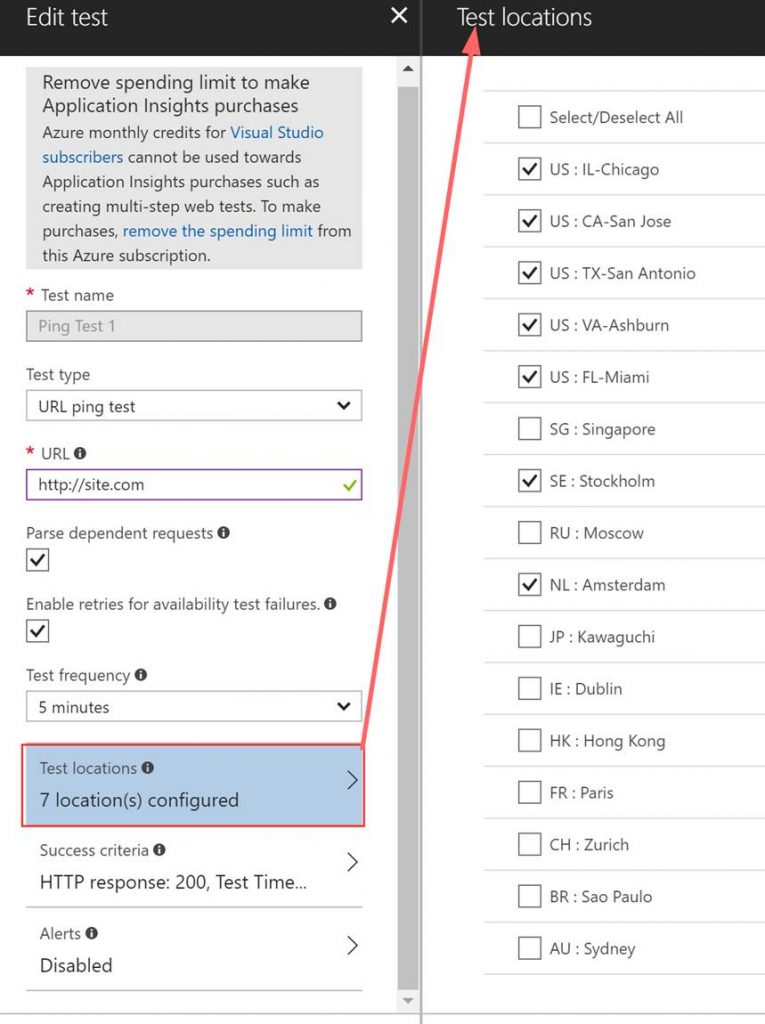
Here is an Example use case for Application Insights:

  • Debug a multi-tier Azure .NET web application for errors and performance issues.
  • Utilize Application Map in Application Insights to discover visually which parts of the application are unhealthy. For the parts that are not healthy drill down using Application Insights to pinpoint the root cause of the errors.

OMS stands for Operations Management Suite. OMS is goes beyond just a tool that can be used for monitoring. It is a suite that also provides, backup, DR, automation and security. It extends to on-premises and it can monitor both IaaS and PaaS. OMS is a platform and has something called solutions. Solutions are used to extend the functionality of OMS. The solutions are packaged management scenarios. I am not going to list out or dive into all of the solutions available for OMS here. Solutions can be found directly in OMS or from the Azure Marketplace. There are a bunch of OMS solutions that can be used to help monitor and gain insight into your Azure PaaS services. The following screenshot has some of the PaaS related solutions that are available for OMS.
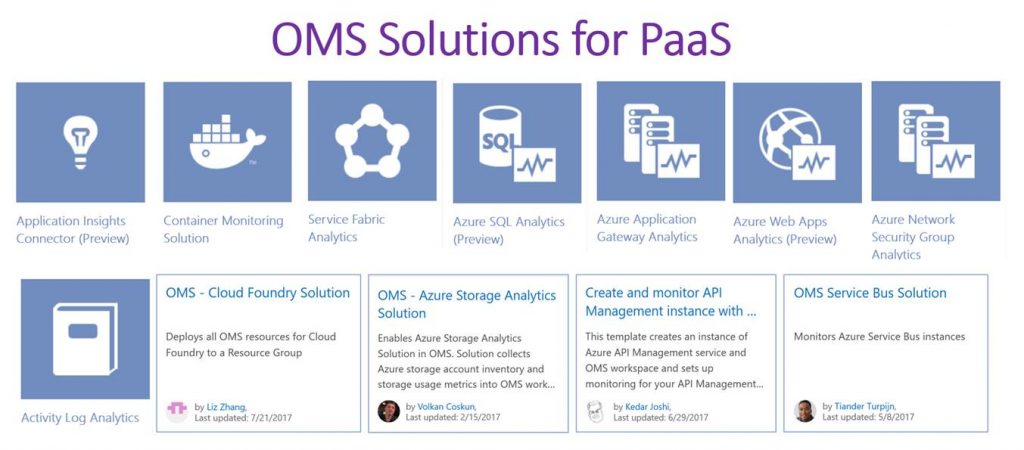
In the previous screenshot the OMS solutions with the white background can be found in the Azure Marketplace while the other OMS solutions will be found directly in OMS. More and more solutions are being added to OMS and the Azure Marketplace all the time.

Below is a screenshot of the Azure Web Apps Analytics OMS solution used to gain insight into an Azure web app/s.
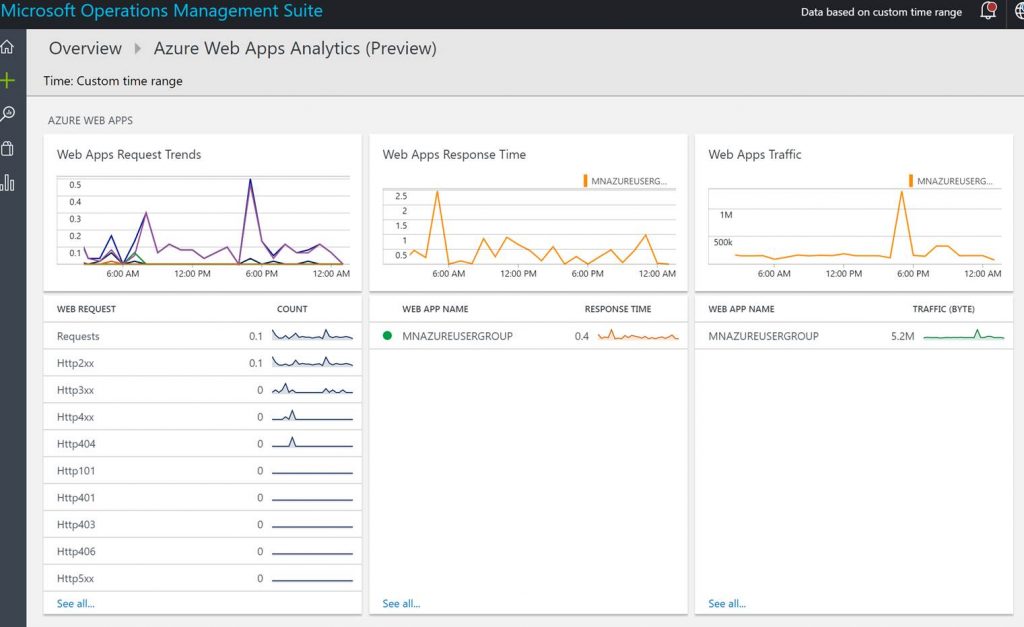
Below is a screenshot of Azure Storage Analytics OMS solution from the Azure Marketplace used to monitor and gain insight into Azure storage.

OMS example use case for monitoring Azure PaaS:

  • Front end application can sometimes connect to a SQL database; and sometimes it cannot. Suspected cause is SQL timeout.
  • Utilize the Azure SQL Analytics to drill-down into SQL timeouts that have occurred on databases.

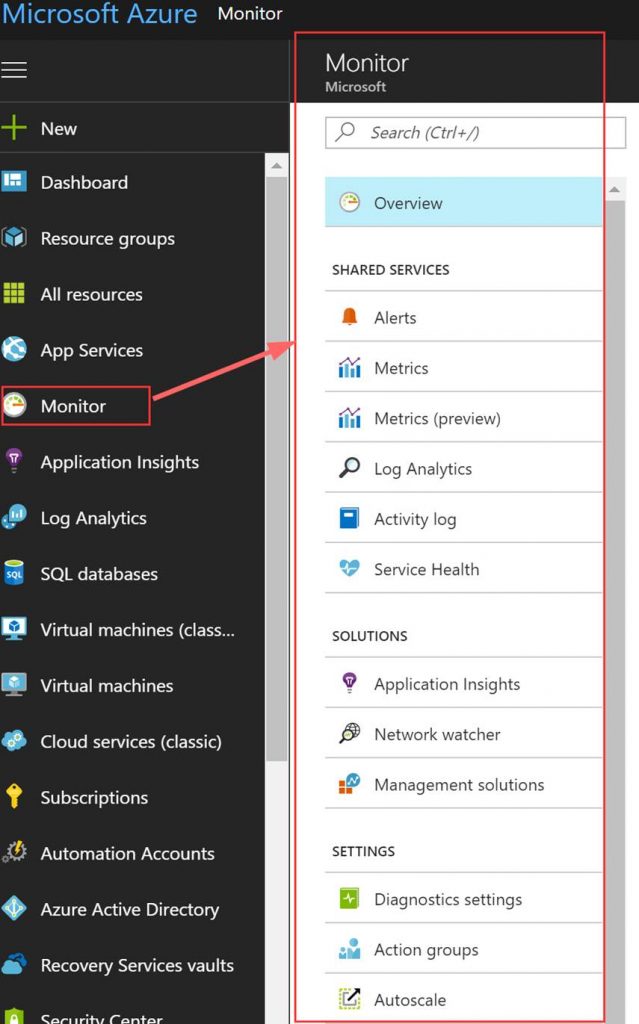
Azure Monitor provides a consolidated place for monitoring data from Azure services and base-level infrastructure metrics/logs from Azure services. It is typically used to track performance, security, and identify trends on Azure services. Azure Monitor brings (OMS) log analytics, application insights, and even network watcher into one place. Azure Monitor is still a relatively new service in Azure and it is still taking shape. Azure Monitor does offer some data that (Application Insights and OMS do not). The data you cannot get in OMS and Application Insights includes the history of Azure service issues, planned maintenance, health advisories, health history, and Azure activity logs.

An example use case for using Azure Monitor to help monitor Azure PaaS is:

  • Need a report of all services issues for a specific region for the past 3 months.
  • Utilize health history in Azure Monitor to pull a list of all service issues for a specific region from the past 3 months. This example can be seen in the following screenshot.
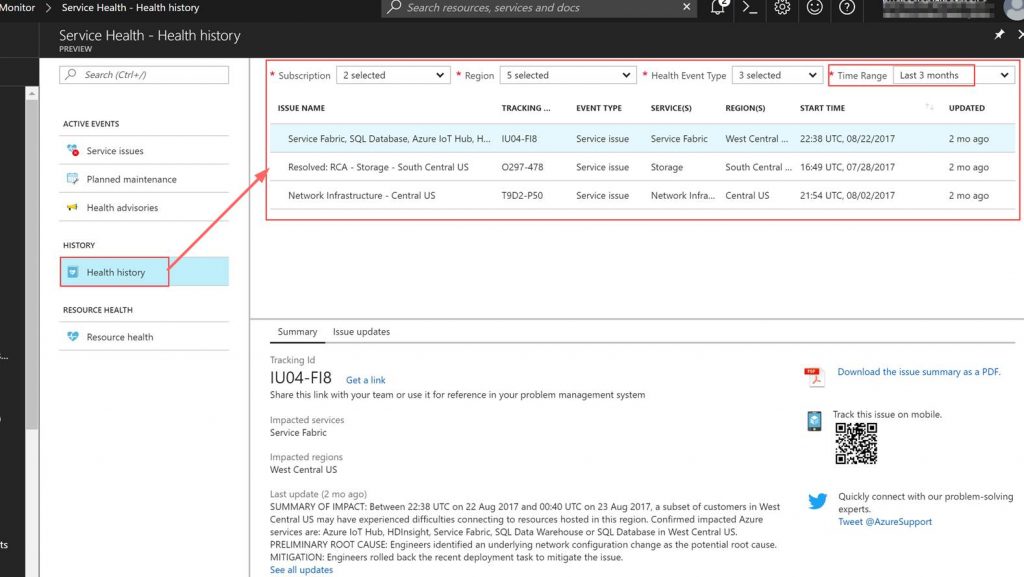
The following screenshot shows the following areas in Azure Monitor that have important Azure monitoring data.
Azure Monitor also has the ability to integrate with many 3rd party solutions that are used by DevOps folks today. The following screenshot is a group of 3rd party integrations that are available for Azure Monitor.
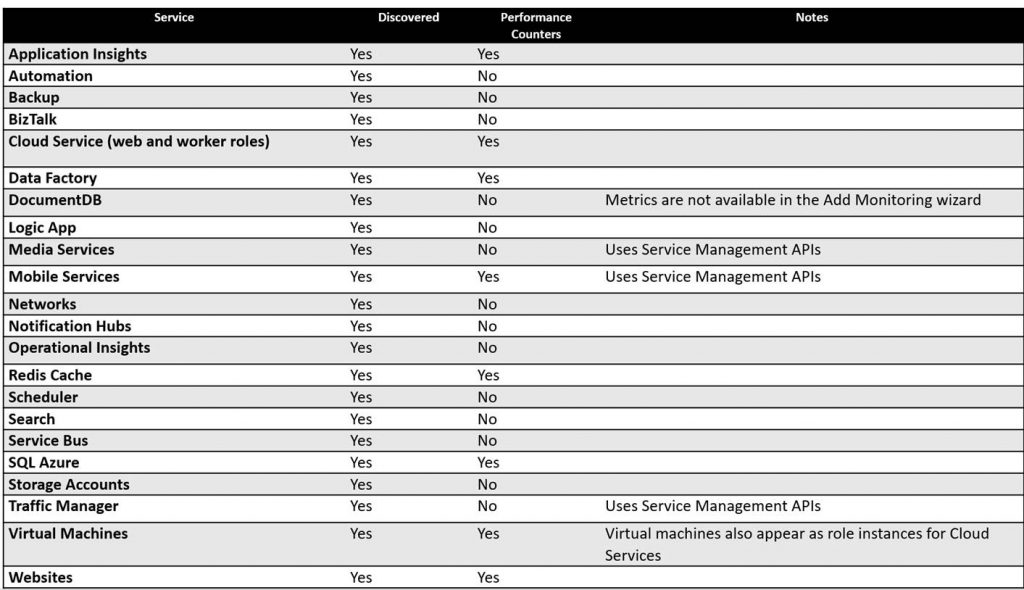
SCOM can be utilized if you want to monitor Azure resources from on-premises you can utilize SCOM for this. There is a management for Azure. There also is a SCOM management pack for Azure Stack. The SCOM management pack for Azure Stack is used to monitor Azure Stack’s fabric. In order to monitor Azure Stack’s IaaS and PaaS you would use the Azure management pack pointing it to your Azure Stack enviroment. The Azure management pack can monitor the availability and performance of Azure resources that are running on Microsoft Azure via Azure REST APIs.

Azure services that can be discovered and monitored with the Azure SCOM management pack.
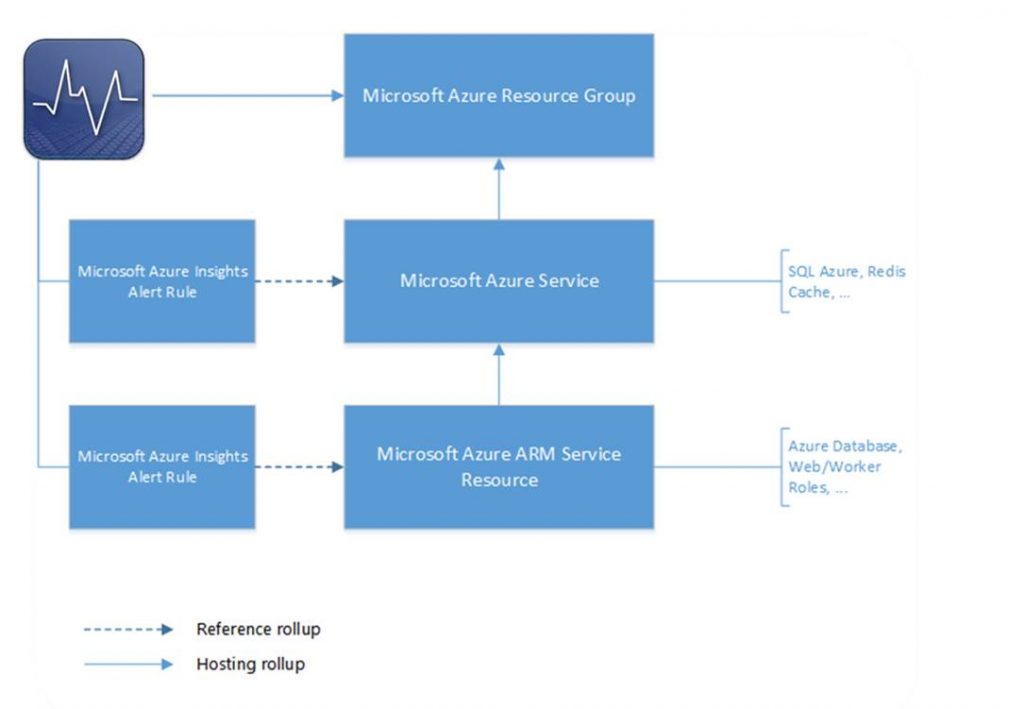
Below is a diagram of how the health rolls up in the Azure SCOM management pack.
Where to get the Azure Management Packs

Azure Management Pack:

https://www.microsoft.com/en-us/download/details.aspx?id=50013

Azure Stack Management Pack:

https://www.microsoft.com/en-us/download/details.aspx?id=55184

But what about security?

This is where Azure Security Center comes into play. Security Center is a unified security management and advanced threat protection for workloads running in Azure, on-premises, and in other clouds.
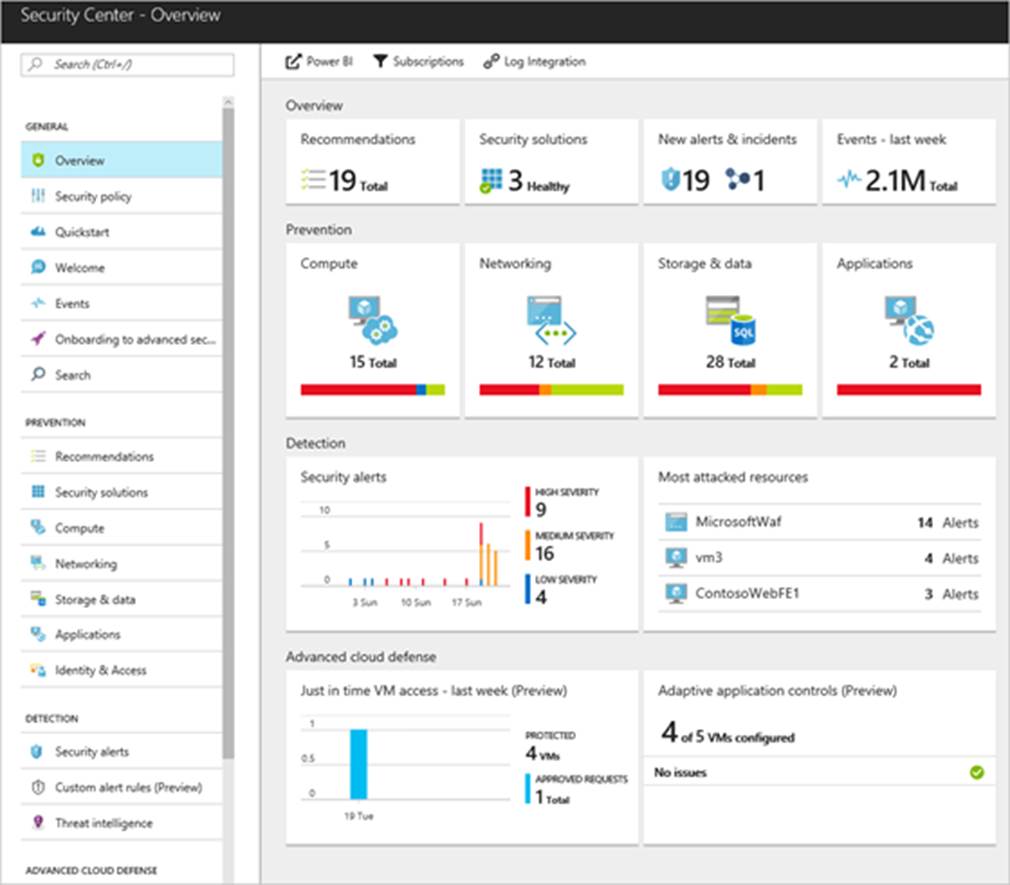
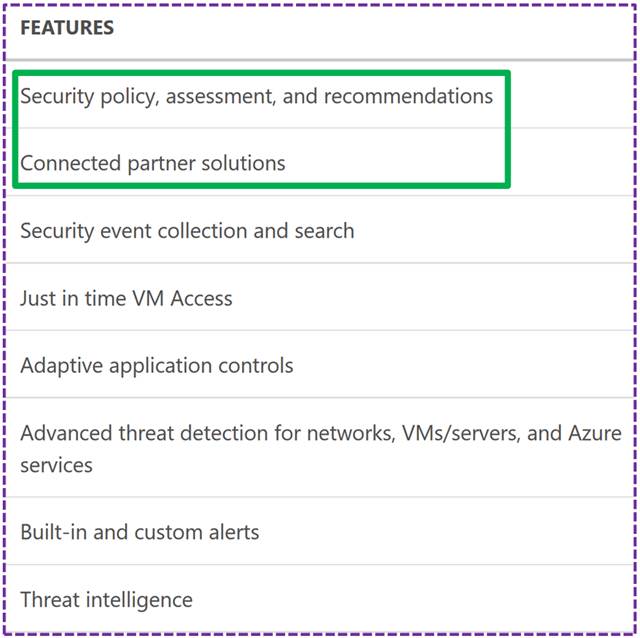
Thanks for reading and stay tuned for more blogs on Azure and Azure Stack.

Read more

OMS and Cherwell ITSM Integration

Microsoft recently released public preview of OMS and ITSM integration. Here is the link for that announcement:

https://blogs.technet.microsoft.com/msoms/2017/05/11/it-service-management-connector-public-preview

Microsoft has built an ITSM connector in OMS. This new ITSM connector can connect to many ITSM solutions out there. The ITSM solutions it can connect to are:

  • System Center Service Manager (SCSM)
  • Cherwell
  • ServiceNow
  • Provance

This new ITSM connector is bi-directional meaning work items can flow from the ITSM solution into OMS and OMS can create work items in the ITSM solution such as incidents, alerts, and events. Hopefully in the future OMS could be used to populate a CMDB and even create application maps from OMS’s Service Map.

I wanted to give this a test run with a test Cherwell instance that I have. There is official documentation for the integrations. The documentation is good however after setting this up I did find that there could be a few more steps spelled out as well as screenshots with the Cherwell piece.

Needed settings from Cherwell:

Before you set the connection in OMS go and get the information you will need. So you will need a username and password of an account that has access to Cherwell, the Cherwell URL, and a Cherwell Client ID.

If you don’t know your Cherwell URL you can get this from the Cherwell client console. Launch Cherwell.

Before you login you can edit the connection to see the URL as shown in the screenshot. You will want to copy this to use in the OMS ITSM connector setup.

Note that you do not want to copy the entire URL. Only copy to the .com like https://test.demo.cherwell.com.

Next we need to generate the Client ID. The Client ID is basically a generated string called the client key used for connecting to Cherwell’s API. To get this client ID Launch the Cherwell Administrator console.

Login and click on Security and then Edit REST API client settings.

A window will pop up and you will need to click on the green plus to create a new one. Give it a name and copy out the Client Key.

Copy this as you will need it later.

Setup in OMS:

Next log into OMS and add the ITSM Connector preview. It is shown in the screenshot below.

After this has been added go to your OMS settings screen click on Connected Sources>ITSM Connector and then click on Add New Connection.

Select Cherwell for the connection type add in your Cherwell settings and save it. If everything worked your OMS is now connected to Cherwell.

Exploring the ITSM Connector:

Next let’s check things out in OMS. Before I did that I first went and created a new incident so I could see this flow over into OMS. So I created the following over in Cherwell:

After doing that I went back into OMS and kicked off a sync because I did not want to wait.

The connector picked up my new incident right away. You can see the dashboard ITSM tile has 2 incidents.

After clicking into this I am brought to the full ITSM dashboard. I then clicked on the Incident tile.

I was then brought to the incident dashboard and I could see the new incident I created.

I clicked on the new incident and it brought me to the OMS search with the details of the incident. Very cool!

I am excited to see cool stuff like this in OMS and integration with many ITSM tools. Look out for more blog posts in the future about ITSM Integration in OMS as well as in Azure Stack.

Read more

Monitor Azure Stack Fabric with OMS

I wanted to monitor my Azure Stack environment with OMS. This would include only the Azure Stack fabric servers and the host. I did not want to manually install the OMS agent on all of these servers especially since the Azure Stack fabric is a set of known servers. So I decided to put together a quick PowerShell script to handle the install of the OMS agents including the workspace ID and key. Here are details for the script:

<#

.SYNOPSIS
This script can be used to install OMS agents on all of the Azure Stack Fabric servers. This has been tested with TP2.

.DESCRIPTION
This script can be used to install OMS agents on all of the Azure Stack Fabric servers. This has been tested with TP2. This script can be run from PowerShell ISE or a PowerShell console. It is recommended to run this from an elevated window. This script should be run from the Azure Stack host. Ensure you are logged onto the Azure Stack host as azurestack\azurestackadmin. This script allows you to input your OMS workspace ID and key. The Azure Stack Fabric servers that this script will attempt to install on is:

“MAS-Con01”,

“MAS-WAS01”,

“MAS-Xrp01”,

“MAS-SUS01”,

“MAS-ACS01”,

“MAS-CA01”,

“MAS-ADFS01”,

“MAS-ASql01”,

“MAS-Gwy01”,

“MAS-SLB01”,

“MAS-NC01”,

“MAS-BGPNAT01”

Fabric servers can be added or removed from the array list if desired. The script will look for the OMS agent (MMASetup-AMD64.exe) in C:\OMS\ on the Azure Stack host. Ensure you create an OMS folder on your Azure Stack host and download the OMS agent to it. This script also copies the OMS agent to C:\Windows\Temp on each Fabric server. Ensure there is enough free space on the C drive on all of your fabric servers.

.PARAMETER OMSWorkSpaceID
This is Guid ID for your OMS workspace, it can be found in the OMS portal at: https://mms.microsoft.com >> Overview >> Settings >> Connected Sources >> Windows Servers

.PARAMETER OMSKey
This is the OMS API key for your OMS workspace. You can use the primary or secondary key. These keys can be found in the OMS portal at:
https://mms.microsoft.com >> Overview >> Settings >> Connected Sources >> Windows Servers

.INPUTS
None

.OUTPUTS
None

.NOTES
Script Name: AzureStackFabrickOMSAgentInstall.ps1
Version: 1.0
Author: Cloud and Data Center Management MVP – Steve Buchanan
Website: www.buchatech.com
Creation Date: 1-1-2017
Purpose/Change: Install OMS agents on Azure Stack Fabric servers.
Updates: None

.EXAMPLE
.\AzureStackFabricOMSAgentInstall.ps1 -OMSWorkSpaceID “20d4dd92-53cf-41ff-99b0-7acb6c84beedsr” -OMSKey “aazedscsjwh52834u510350423tjjwgogh9w34thg2ui==”
#>

The script can be downloaded here:
https://gallery.technet.microsoft.com/Azure-Stack-Fabric-OMS-3dac666c

To kick off the script run from PowerShell ISE or a PowerShell console. If you run from ISE you will be prompted for the workspace ID and the key. If you run from a PowerShell console run this syntax to kick it off:

.\AzureStackFabricOMSAgentInstall.ps1 -OMSWorkSpaceID “YOURWORKSPACEID” -OMSKey “YOUROMSKEY”

The script will kick off, building an array of the Azure Stack VM’s, looping through each of them to copy over the OMS agent, and then install the OMS agent setting the OMS workspace ID and key.

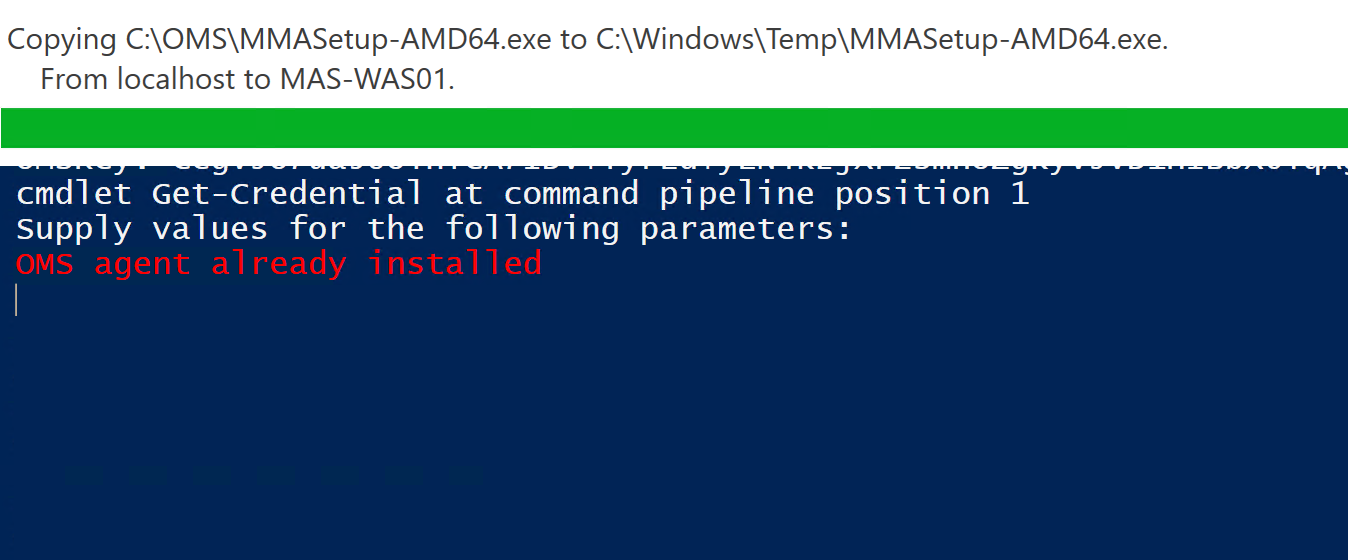
The script will detect if an OMS agent is already installed and will skip that server as shown in the following screenshot.

Otherwise the script will install the OMS agent as shown in the following screenshot.

The following screenshot shows the script running in a PowerShell console vs ISE.

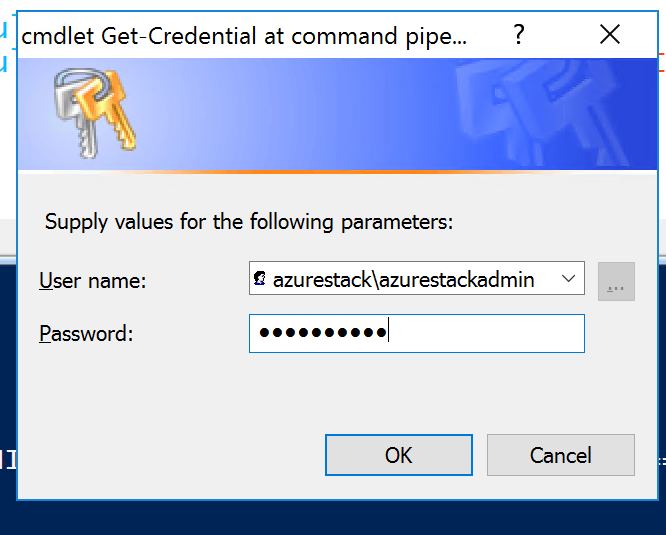
You will be prompted when running the script for credentials. Use Azurestack\azurestackadmin as shown in the following screenshot.

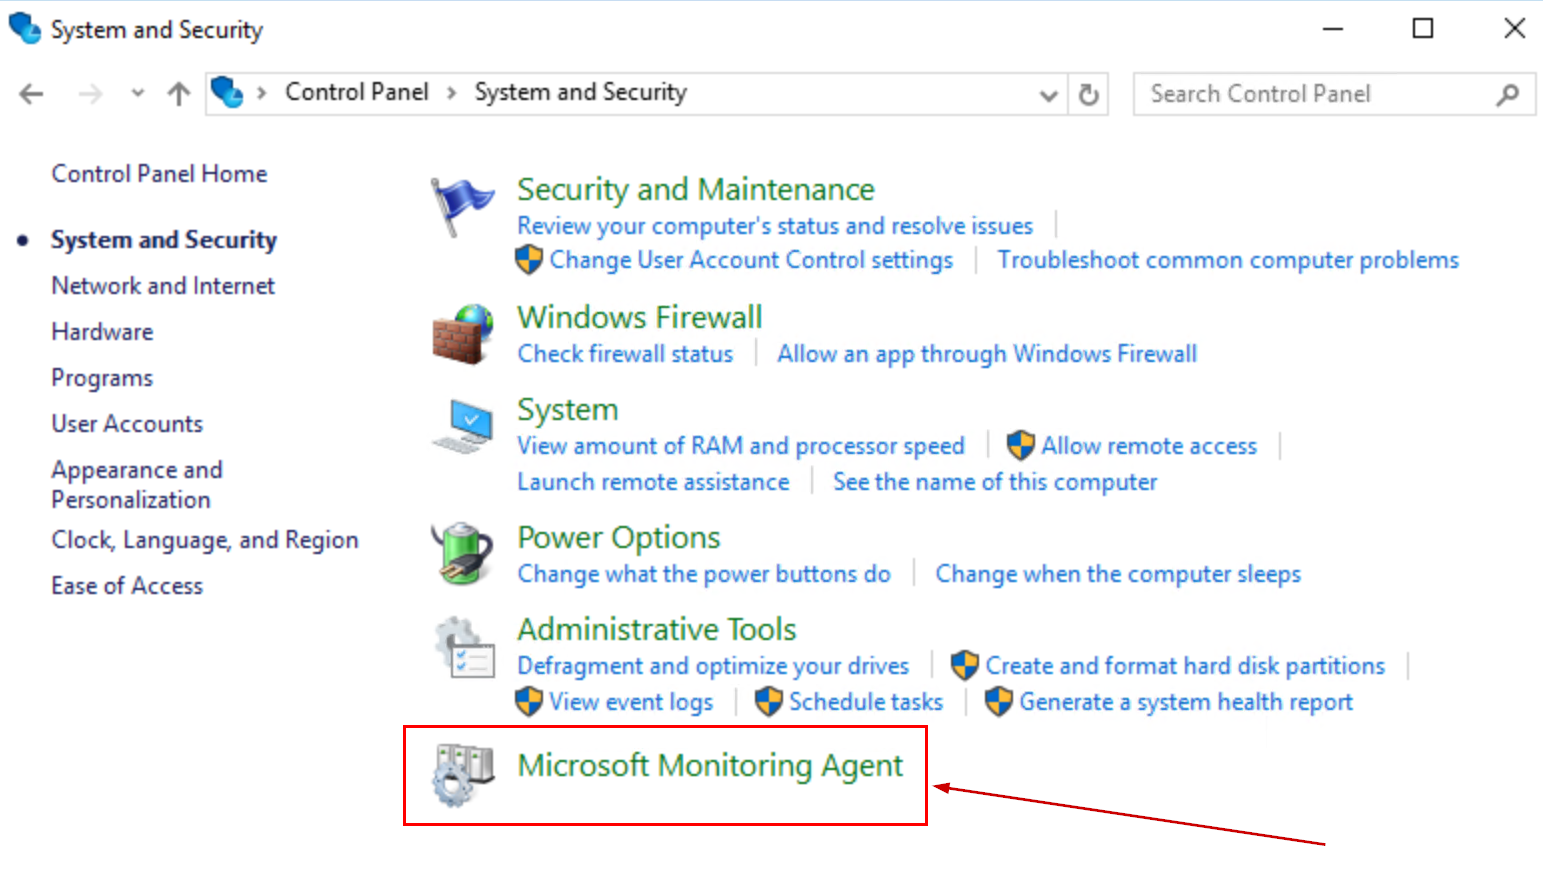
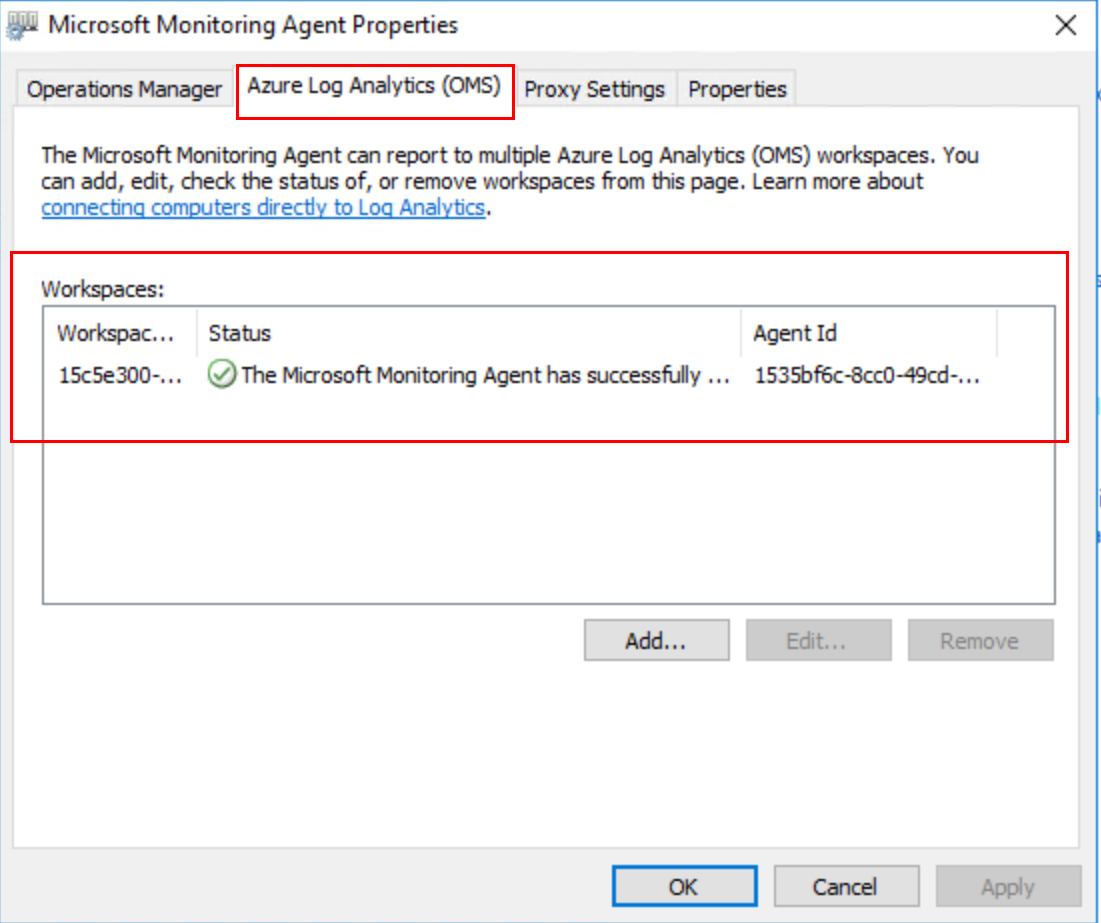
After the OMS agent is installed you should be able to log onto any of the Azure Stack VM’s and see the OMS agent in control panel as shown in the following screenshots.


You can also log onto OMS and see your Azure Stack servers listed under connected computers.

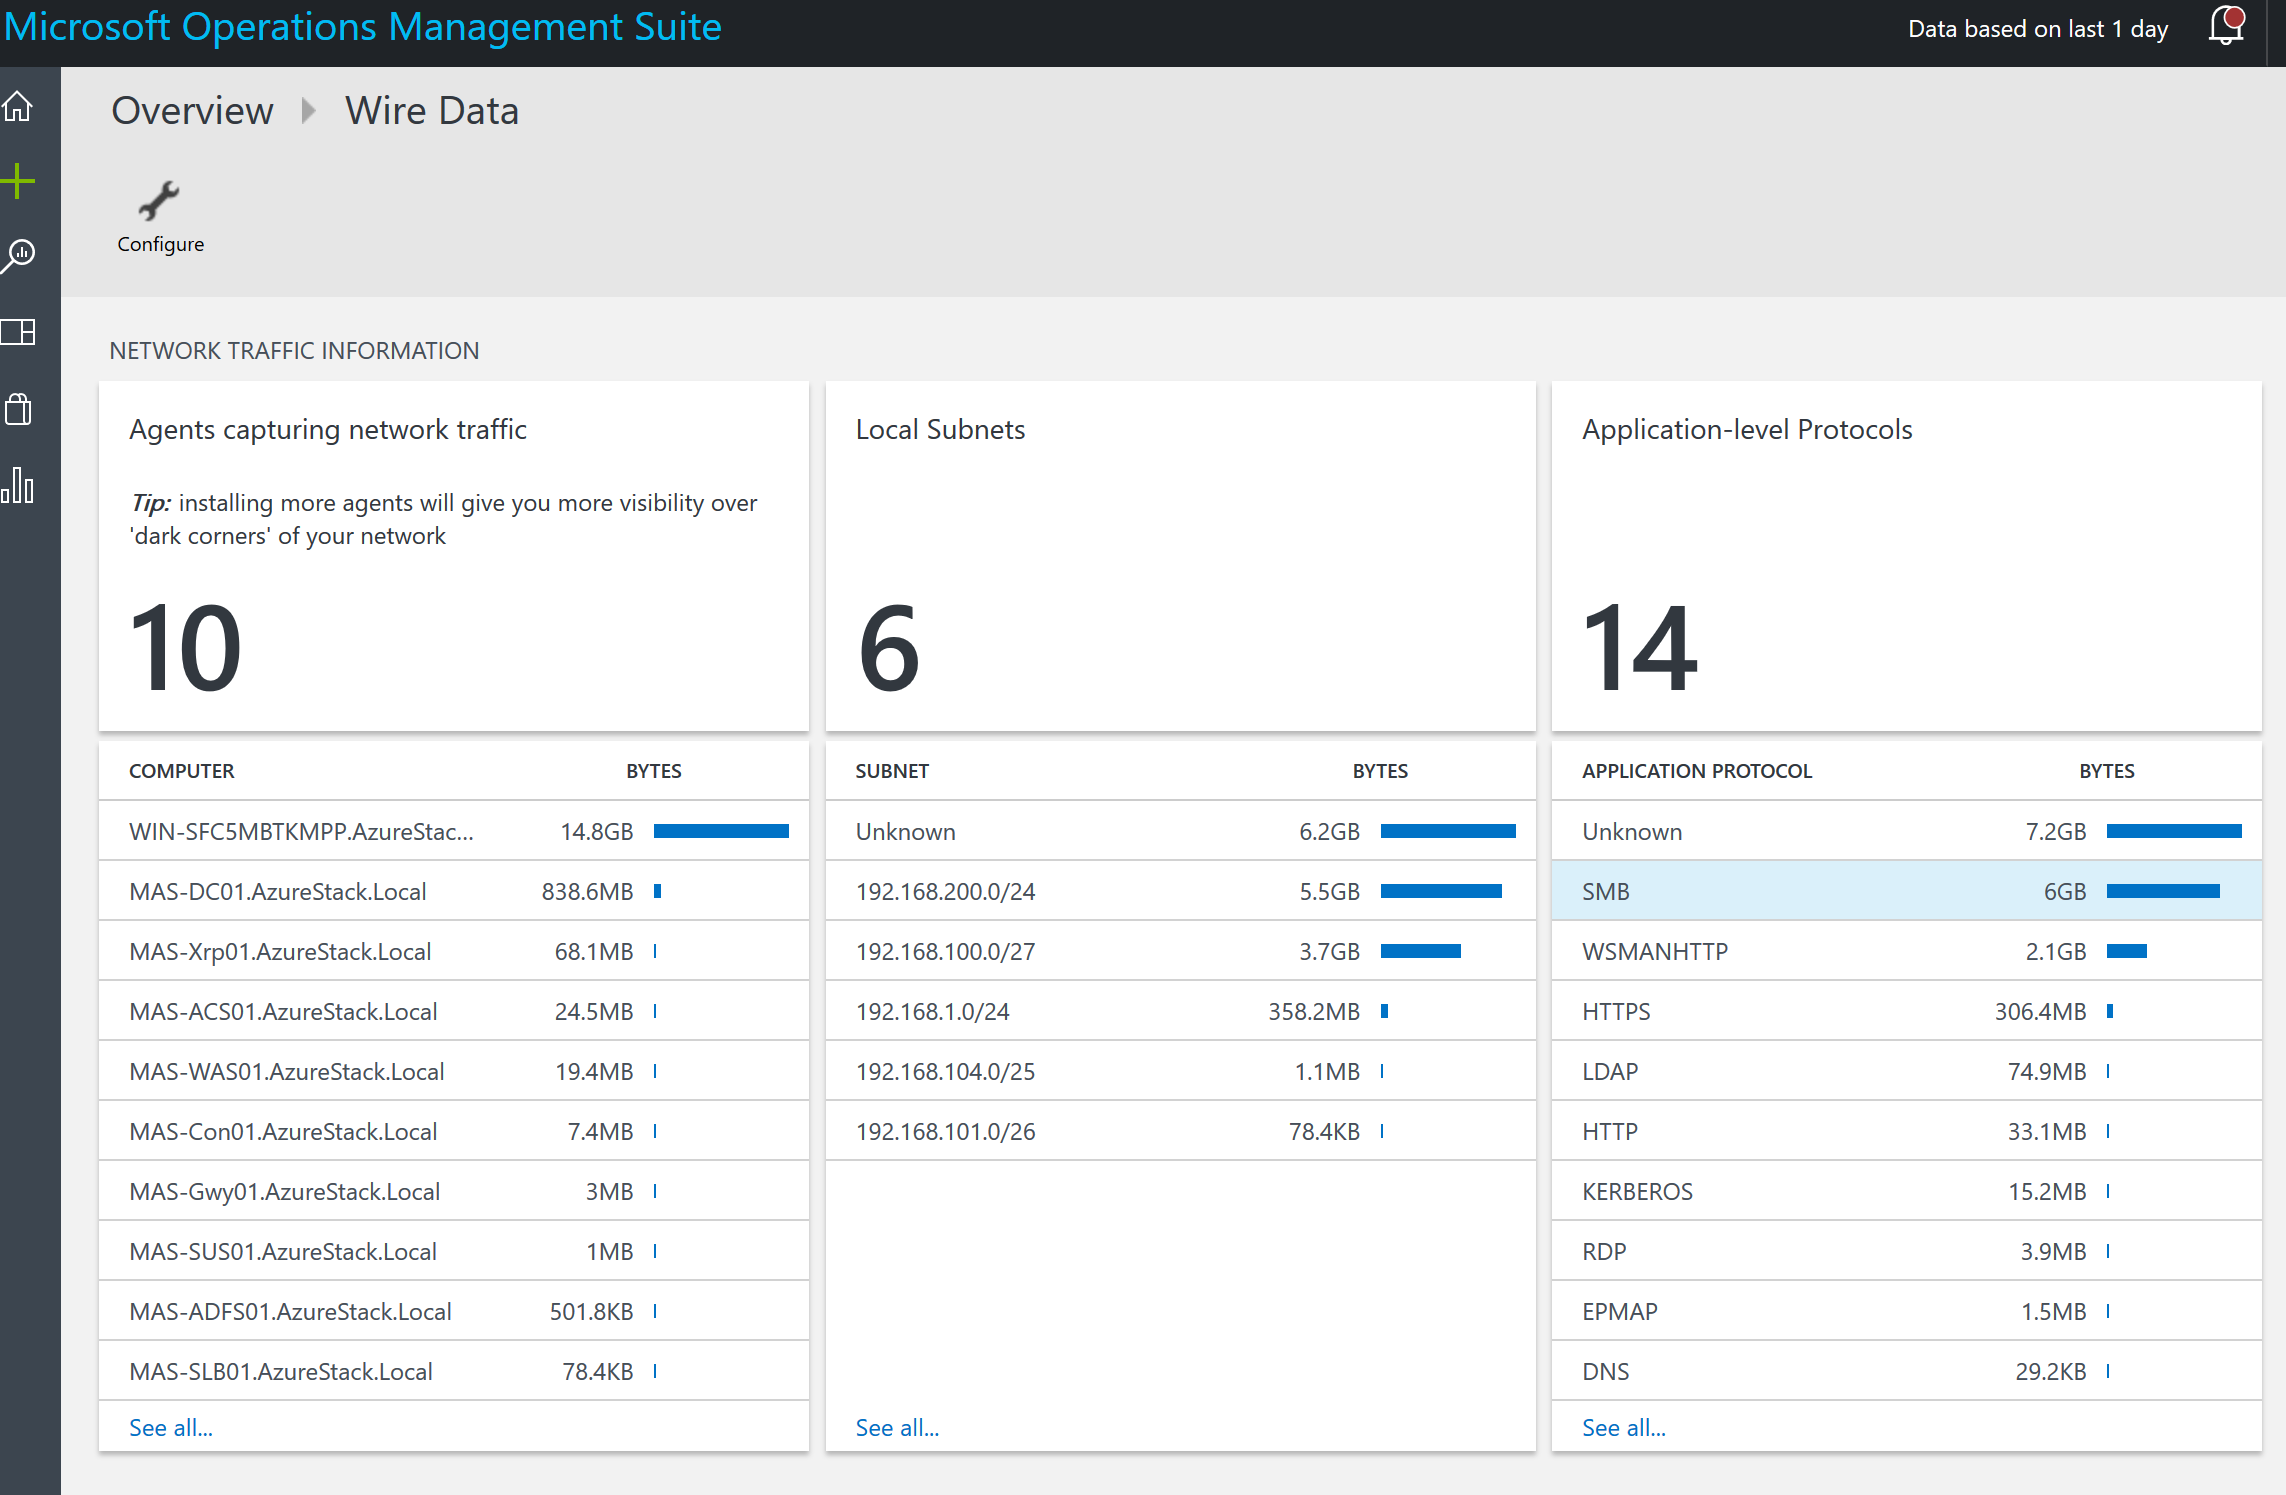
Azure Stack fabric servers wire data:

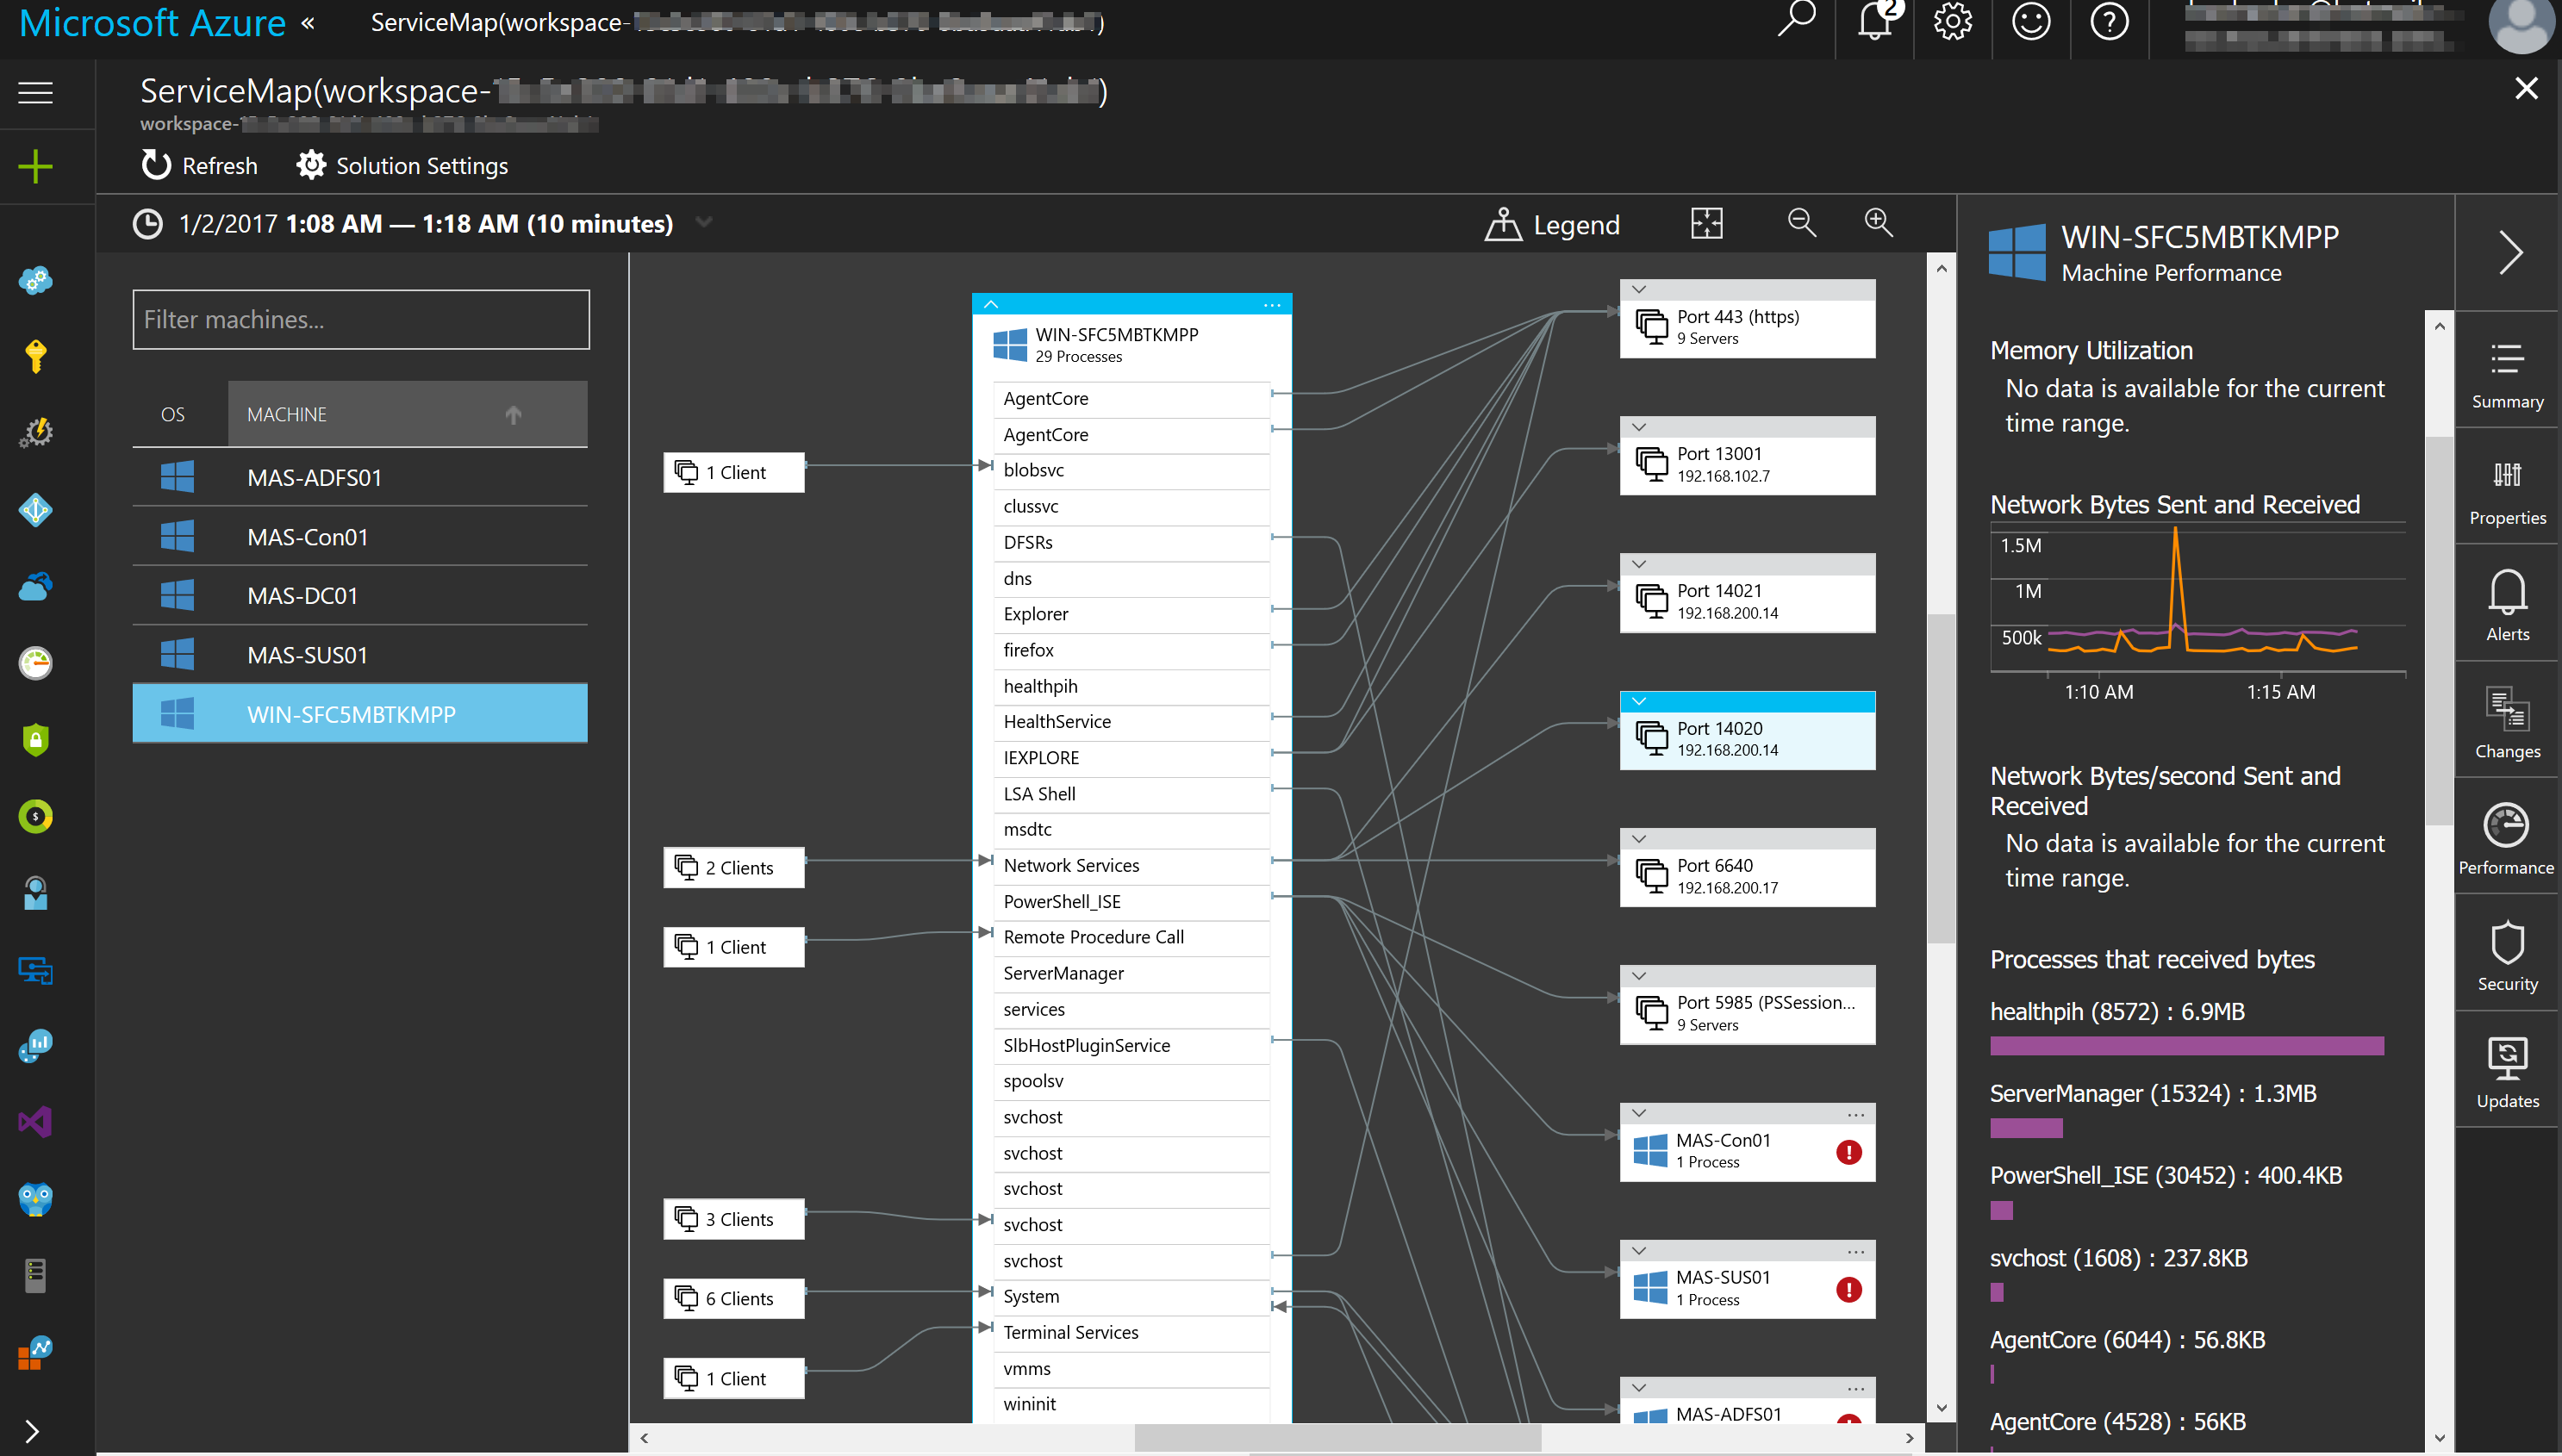
My Azure Stack host in OMS Service Map:

Happy Stacking and OMS’ing!

Read more

OMS: Service Map overview

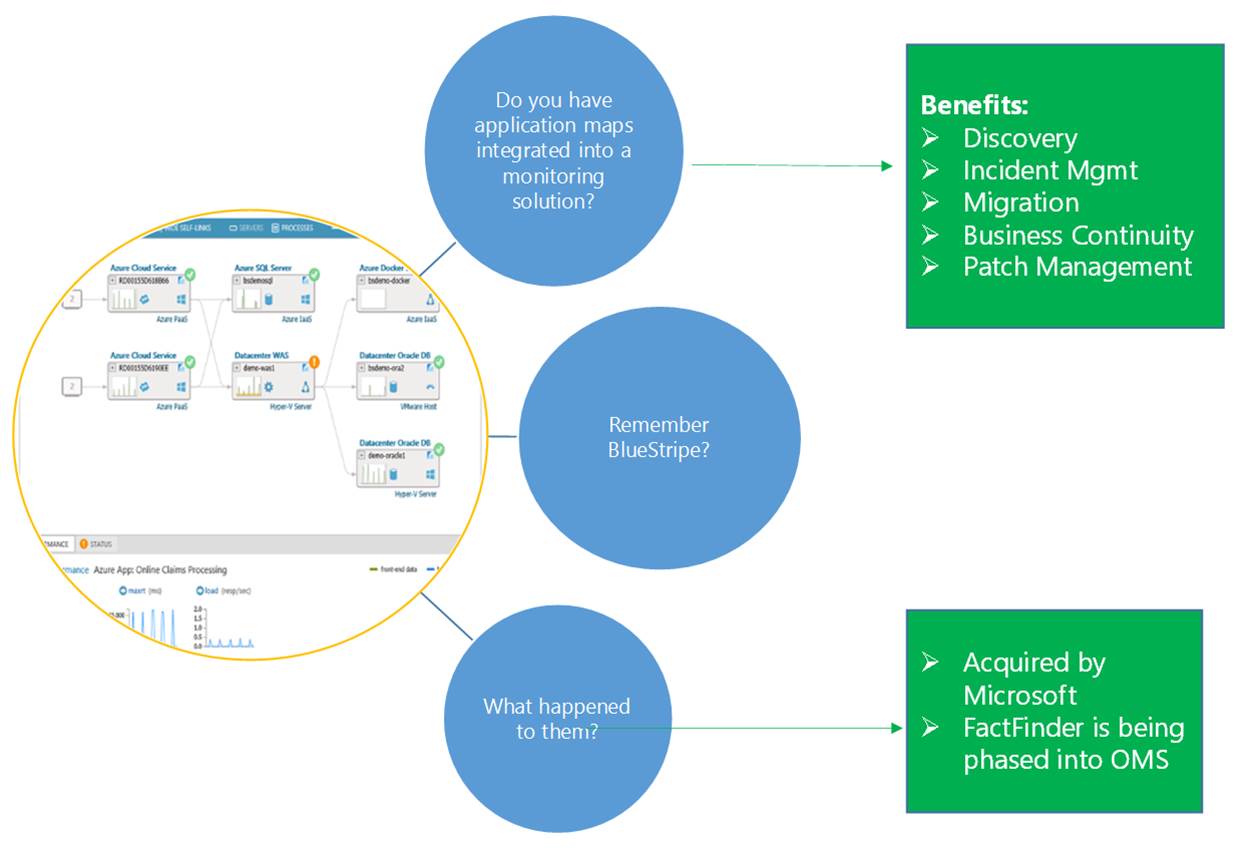
Recently the Operations Management Suite (OMS) team at Microsoft announced the private preview of Service Map in OMS formally known as Application Dependency Map. Service Map has been a long awaited feature in OMS. Service Map is a feature that is a part of OMS that discovers and maps Windows & Linux app and system dependencies. Service Map displays these dependencies in application maps within OMS. Service Map did not start with OMS. It actually started as a standalone product named Fact Finder and later was integrated with SCOM. The integration of FactFinder with SCOM allowed Bluestripe to automatically create Distributed Applications in SCOM. Well Microsoft acquired BlueStripe and the rest is history.

In this post I will set out to explore and break down Service Map, how it is installed, info about the agent, how it works, key points about it, how the data flows and more. NOTE: Click on any of the images in this post to display larger in a new window. Also this post is my first effort in taking one of my PowerPoint’s and converting into a post! The following graphic describes some of the benefits of having application maps including in your monitoring solutions along with information about FactFinder:

oms-servicemap-overview-1

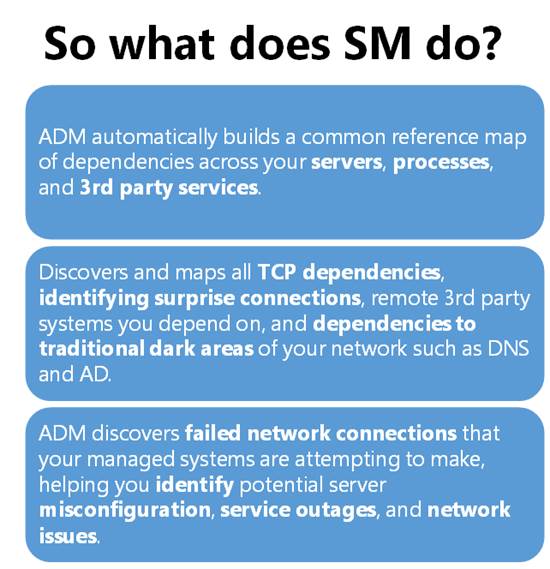
Now let’s take a look at what Service Map does and how it looks.

oms-servicemap-overview-2

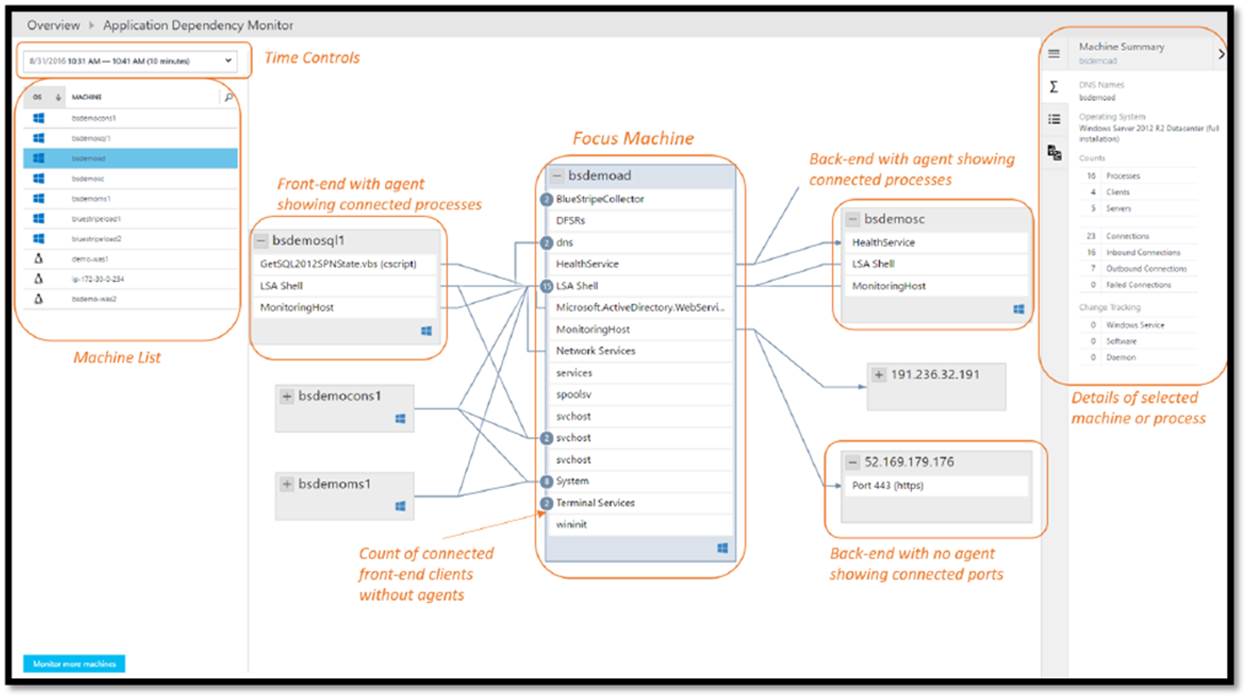
Now let’s take a look at one of the Service Maps aka Application Maps in OMS. Notice on the left hand side the breakdown of the interface. In Service Map there is a focus machine in the center. There are front end and back end connections into that focus machine. These are the dependencies flowing in and out of the focus machine giving the mappings. Notice on the left-hand side you can control the time controls and select either a Windows or Linux machine from the list. Finally, on the left-hand side are the details of the current selection. The current selection can be a machine or process.

oms-servicemap-overview-3

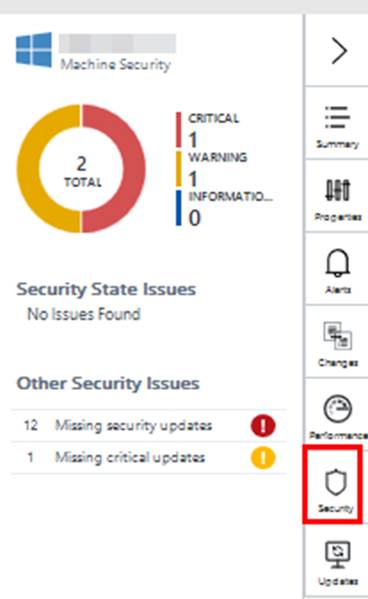
Also notice that SM integrates with Change Tracking, Alerts, Performance, Security, and updates. What this means is that when you have a focus machine selected you can click on the corresponding solution on the right hand. When you click on the solution i.e. updates or security the update or security dashboard widget will be shown and you can drill down from there for further detail.

oms-servicemap-overview-4

oms-servicemap-overview-5

A common question that comes up when discussion Service Map is how does it work. The following graphic displays the process from the solution add to the actual mapping within OMS.

oms-servicemap-overview-6

Other key information about Service Map is detailed in the following graphics.

oms-servicemap-overview-7

The next graphic looks at deploying the SM agent and locations for logs. The process is as simple as downloading and installing the agent from OMS.

Here is some more critical information you need to know about the SM agent.

oms-servicemap-overview-9

This next graphic details how Service Map dependency data flows into OMS.

oms-servicemap-overview-10

At this current time Service Map supported Operating Systems at this time are:

Windows Linux
  • Windows 10
  • Windows 8.1
  • Windows 8
  • Windows 7
  • Windows Server 2016
  • Windows Server 2012 R2
  • Windows Server 2012
  • Windows Server 2008 R2 SP1
  • Oracle Enterprise Linux 5.8-5.11, 6.0-6.7, 7.0-7.1
  • Red Hat Enterprise Linux 5.8-5.11, 6.0-6.7, 7.0-7.2
  • CentOS Linux (Centos Plus kernel is not supported)
  • SUSE Linux Enterprise Server 10SP4, 11-11SP4

Service Map’s computer and process inventory data is available for search in OMS Log Analytics. This is very cool as the log analytics and searching capability in OMS is powerful and most important very FAST. Having application components, service dependencies, and supporting infrastructure configuration data at your fingertips through the log analytics gives you a powerful troubleshooting and forensics tool. I am sure over time the query capabilities will be expanded to include even more.

 oms-servicemap-overview-11  oms-servicemap-overview-12
Type=ServiceMapComputer_CL Type=ServiceMapProcess_CL

A few Service Map Log Analytic query examples:

List the physical memory capacity of all managed computers:

Type=ServiceMapComputer_CL | select TotalPhysicalMemory_d, ComputerName_s | Dedup ComputerName_s

List computer name, DNS, IP, and OS version:

Type=ServiceMapComputer_CL | select ComputerName_s, OperatingSystemVersion_s, DnsNames_s, IPv4s_s | dedup ComputerName_s

List Process Map by process name:

Type=ServiceMapProcess_CL (ProductName_s=TeamViewer)

Thanks for reading and I hope you enjoyed this post on OM’s Service Map. Now go out and add the public preview right away.

Read more

Presenting at MMS 2016 – Azure Stack, Backup, & OMS

It’s almost time for MMS 2016. By the end of Friday 4-22-16 MMS registration will be closed as the event has sold out! This year I have the opportunity to present twice and help facilitate one of the pre-con sessions. Here is a breakdown of my sessions.

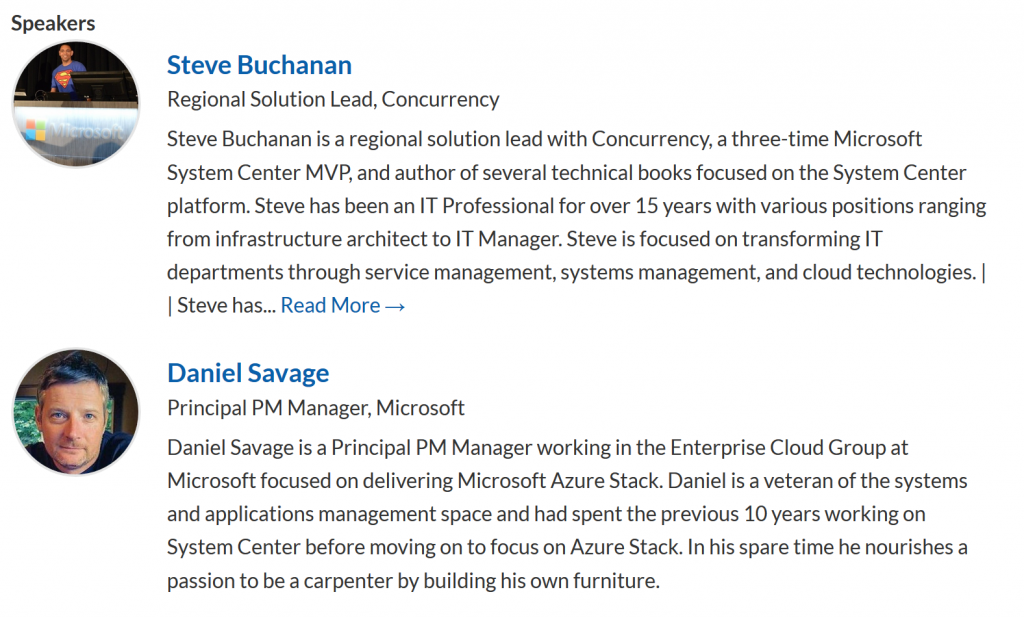
Session #1: My first session is on Azure Stack the new Hybrid solution from Microsoft! This session will include me and Daniel Savage an Azure Stack program manager from Microsoft! You never know what new never heard before stuff you might learn about in this session. I recommend you sign up. Here is the title, description, and link for this session:

TITLE: – Future-proof your Career with Azure Stack in the New Hybrid Cloud World! –

DESCRIPTION: “Write once, deploy anywhere”, “extension of Azure”, “cloud agility”, “Cloud in your data center” What do all these buzz words mean to you and your career? How does Azure Stack Microsoft’s Hybrid solution apply to you as an IT Pro? Does Hybrid Cloud really have a place in the enterprise?

Come to this session and let Azure Stack Program Manager Daniel Savage and MVP Steve Buchanan unpack it for you.

SPEAKER BIOS:

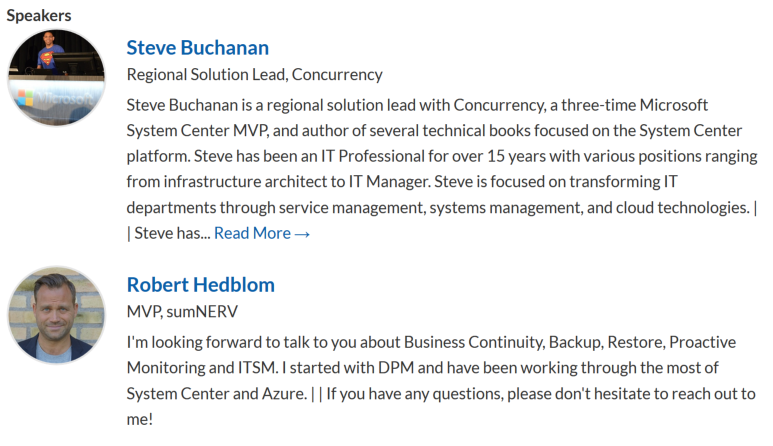
Future-proof your Career with AzureStack

LINK: http://sched.co/6Xjn

Session #2: In my second session I will be presenting with my good friend and fellow MVP Robert Hedblom. He is making the trip all the way across the pond from Sweden for this event. Our goal for this session is to save jobs! hahaha…. You don’t want to miss this session as we take you through the steps of designing your backup and restore strategies. Here is the title, description, and link.

TITLE: – Be a Hero or be Fired. Backup and Restore Strategy –

DESCRIPTION: Did you skip planning the backup strategy? If a disaster occurred could you restore or would you get fired?

Come see System Center MVP’s Steve Buchanan and Robert Hedblom walk you through building a bullet proof backup and restore strategy of your business services. These strategies can be used with Microsoft business continuity tools. Learn how to be a restore hero in the event of a disaster and keep your JOB!

SPEAKER BIOS:

Be a Hero or be Fired. Backup and Restor

LINK: http://sched.co/68×3

Session #3: The third session is actually a 4 hour pre-con session about Operations Management Suite (OMS). This is a session you don’t want to miss. This session will be jam packed with MVP and Microsoft rock-stars! It will be jam packed with deep knowledge and again you never know what new never heard before stuff you might learn about in here. In this session you will have direct access to the Microsoft product team that is behind OMS. I am honored to be a part of this session. I have the opportunity to help facilitate it. Here is the title, description, speaker bio’s and link for this session.

TITLE: OMS from “What is this?” to “Wow, it can do that?!” –

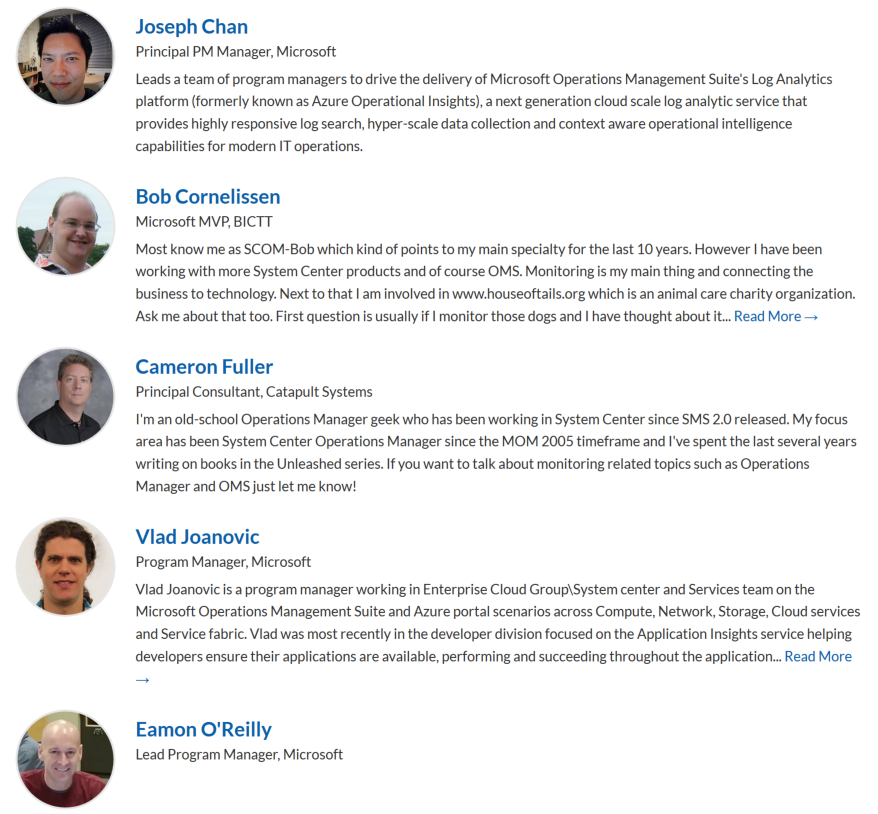
DESCRIPTION: This is a pre-con session where emcee’s Steve Buchanan and Cameron Fuller will facilitate a four hour session designed to explain what OMS is and what it can do for your organization.

In the first hour Bob Cornelissen (SCOMBob) and Cameron Fuller will provide an introduction to what OMS is and what benefits it can provide your organization.

In the second 1.5 hour session, join the Microsoft product team members as they dig in deep on IT automation within OMS.

In the final 1.5 hour session, join the Microsoft product team members as they dig in deep on Log Analytics & Security / Compliance.  

SPEAKER BIOS:

OMS Pre-con

LINK: http://sched.co/6MtU

See you at MMS 2016!

MMS

http://mmsmoa.com

Read more

2015 MVP Summit and MMS 2015

The past two weeks have been full of tech awesomeness. The first week was the 2015 MVP Summit and the second week was MMS 2015. I will recap both of these in this post. Well for the MVP Summit I can’t actually say anything about it but I can post a couple of cool pictures from it. 🙂 Here are some pics from the Summit.

With PowerShell MVP Trevor Sullivan and my roommate/friend CDM MVP Jakob Svendsen during breakfast.

With the man! Mr. OMS/System Center Jeremy Winter.

Good discussion with a bunch of smart guys. CDM MVP Stanislav Zhelyazkov (Stan the man), CDM MVP legend Cameron Fuller, and CDM MVP Jedi Dieter Wijckmans.

Read more

2 Sessions at MMS 2015

I am late posting this but better late than not at all. Next week I will be presenting at MMS 2015 on November 9th and 11th. In this post I will break down what each session is about. This is the second year of the community powered MMS event. The Midwest Management Summit is a 3-day conference purposely capped to just 500 attendees so that nobody gets lost in the crowd. Almost 60 Microsoft MVP’s will be presenting on System Center, cloud, PowerShell topics and more.

Areas the speakers will be presenting on are Operations Management Suite (OMS), Enterprise Mobility Suite (EMS), Operations Manager, Configuration Manager, Orchestrator, Service Management Automation, Azure Automation, Service Manager, Data Protection Manager, Azure Backup, Azure Pack, Azure Stack, Hyper-V, Nano server, PowerShell, Desired State Configuration and more. I am lucky to be co-presenting with two awesome System Center experts Natascia Heil @NatasciaHeil and Chiyo Odika @mrchiyo. The first session I will be presenting is:

-Real world automation with Service Manager and Azure Automation-

Here is what to expect from this session:

Automation is not only requesting and building virtual machines through Service Manager and Orchestrator. Automation can do much more and Service Manager can be combined with Microsoft’s other automation tools such as SMA, Azure Automation, and DSC. This session will teach you how to identify areas of automation in your company. It will cover automation fits in the ITIL story. It will also show some real life automation examples utilizing Microsoft newest automation tool (Azure Automation) and Service Manager.

We have two demo’s planned for this session. The first demo will show how to use Service Manager and Azure Automation. The second demo will show automating patch management using SCCM, Orchestrator, and Service Manager’s change management.

clip_image001

Link to this session:

http://mms2015.sched.org/event/bc3ffcd6aaaaef9a5e765493a0e6527f?iframe=no#.VjsTBeJcxps

The second session I will be presenting is:

-OMS Strategies and Notes from the Field-

Here is what to expect from this session:

OMS is a comprehensive web-based cloud IT Management solution with monitoring, automation and other features and solutions that will provide you with greater control and new capabilities across your hybrid cloud.

In this session, you will learn about strategies for getting the most out of OMS, best-practices, and learn from our extensive experiences in the field, deploying, configuring, and troubleshooting OMS.

clip_image002

Link to this session:

http://mms2015.sched.org/event/a4fb2e8bd31e7cab0de55695f9ec48a1#.VjsTCOJcxps

For more information on MMS 2015 and a full list of speakers and sessions visit:

http://mmsmoa.com/

Read more

Unpacking The Operations Management Suite Android App

A while back there was a suggestion on Azure Operational Insights (Before renamed to Operations Management Suite) User Voice for an Android APP. You can see that here: http://feedback.azure.com/forums/267889-azure-operational-insights/suggestions/6686744-android-mobile-app . This would allow us to access our OMS data from our Android mobile device! It is no secret I am an Android user so I was excited for this. On the User Voice thread Microsoft commented that we could expect an app in the fall of 2015. Well on October 15th one of my colleagues Rob Plank tweeted that there the OMS Android app was available in the Android market (https://twitter.com/rob_plank/status/654706738222907392). They kept their word and now we have an Android App for OMS! In this post we are going to take a tour of the new OMS Android App.

On your phone you can search Google Play for Microsoft OMS or click this link Operations Management Suite to find the app. Go ahead and install it.

clip_image001

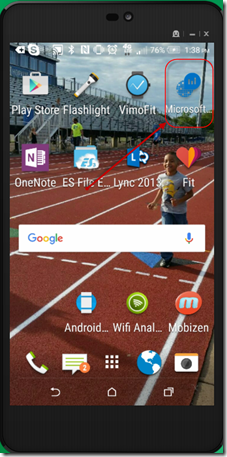
Once installed you will find it with your other apps.

clip_image002

You can also place a shortcut to it on one of your main screens.

clip_image003

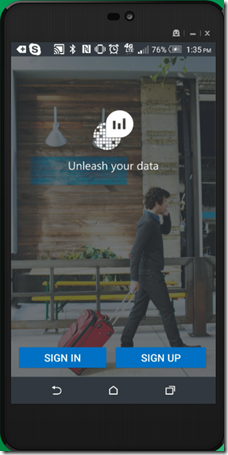
The first time you launch it you will need to either sign in or sign up.

clip_image004

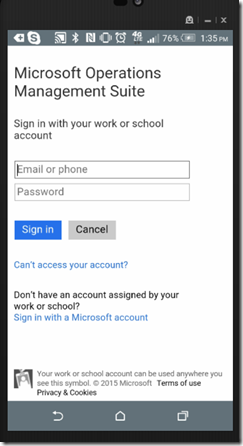
Here is a screenshot of the sign in screen.

clip_image005

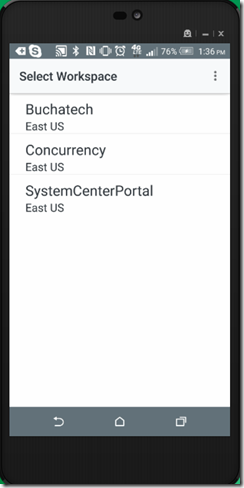
After you are logged in you need to select your workspace. You can see that I have 3 workspaces. Yes only a true geek would have multiple workspaces in OMS. LOL

clip_image006

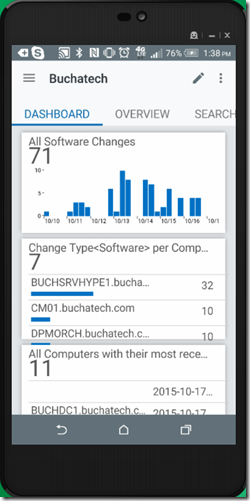
After selecting your workspace you will have a similar look and feel to the web based version of OMS. You will also notice 3 main areas Dashboard, Overview, and Search. The first one you will land on is Dashboard. To access the other 3 main areas just scroll to the right. NOTE: I did not see a way to add solutions to OMS from the mobile app. You will need to do this from the web application itself.

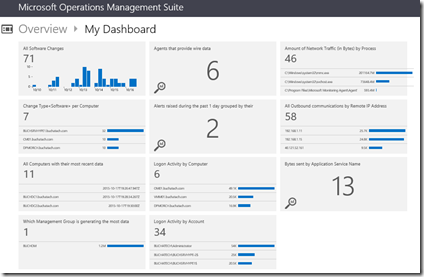
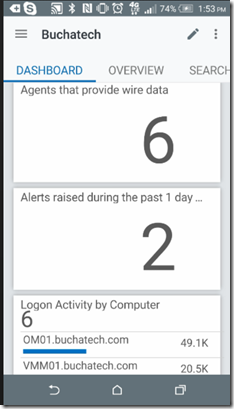
The Dashboard view is equal to My Dashboard in the full OMS web application. So whatever you added to your My Dashboard is what you will see here.


Android OMS App Full OMS Web Application
clip_image007 clip_image008
clip_image009

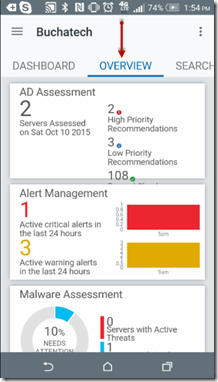
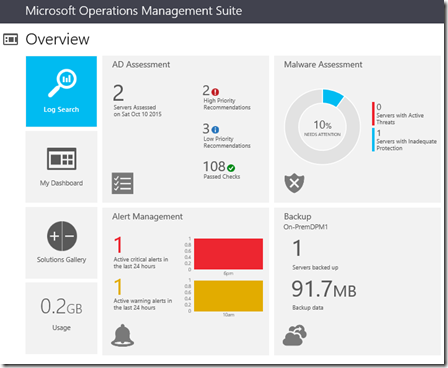
Now if we go the Overview area this is the same view as we have on the full OMS web application. Overview has the solutions that you have added to your OMS. To see them all just scroll down.

Android OMS App Full OMS Web Application
clip_image010 clip_image011

You will notice the Searches view also matches what is in “Log Search” in the full OMS web application.

clip_image012

Read more