Part of running Kubernetes is being able to monitoring the cluster, the nodes, and the workloads running in it. Running production workloads regardless of PaaS, VM’s, or containers requires a solid level of reliability. Azure Kubernetes Service comes with monitoring provided from Azure bundled with the semi-managed service. Kubernetes also has built in monitoring that can also be utilized.
It is important to note that AKS is a free service and Microsoft aims to achieve at least 99.5% availability for the Kubernetes API server on the master node side.
But due to AKS being a free service Microsoft does not carry an SLA on the Kubernetes cluster service itself. Microsoft does provide an SLA for the availability of the underlying nodes in the cluster via the Azure Virtual Machines SLA. Without an official SLA for the Kubernetes cluster service it becomes even more critical to understand your deployment and have the right monitoring tooling and plan in place so when an issue arises the DevOps or CloudOps team can address, investigate, and resolve any issues with the cluster.
The monitoring service included with AKS gives you monitoring from two perspectives including the first one being directly from an AKS cluster and the second one being all AKS clusters in a subscription. The monitoring looks at two key areas “Health status” and “Performance charts” and consists of:
Insights – Monitoring for the Kubernetes cluster and containers.
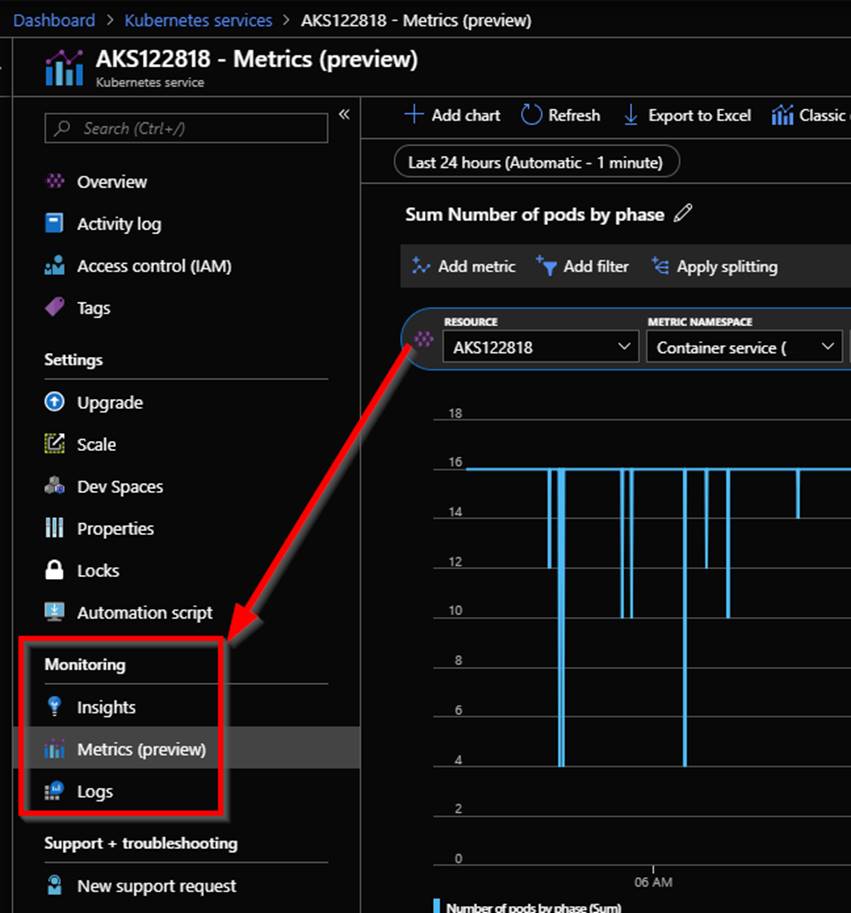
Metrics – Metric based cluster and pod charts.
Log Analytics – K8s and Container logs viewing and search.
Azure Monitor
Azure Monitor has a containers section. Here is where you will find a health summary across all clusters in a subscription including ACS. You also will see how many nodes and system/user pods a cluster has and if there are any health issues with the a node or pod. If you click on a cluster from here it will bring you to the Insights section on the AKS cluster itself.

If you click on an AKS cluster you will be brought to the Insights section of AKS monitoring on the actual AKS cluster. From here you can access the Metrics section and the Logs section as well as shown in the following screenshot.
Insights
Insights is where you will find the bulk of useful data when it comes to monitoring AKS. Within Insights you have these 4 areas Cluster, Nodes, Controllers, and Containers. Let’s take a deeper look into each of the 4 areas.
Cluster
The cluster page contains charts with key performance metrics for your AKS clusters health. It has performance charts for your node count with status, pod count with status, along with aggregated node memory and CPU utilization across the cluster. In here you can change the date range and add filters to scope down to specific information you want to see.

Nodes
After clicking on the nodes tab you will see the nodes running in your AKS cluster along with uptime, amount of pods on the node, CPU usage, memory working set, and memory RSS. You can click on the arrow next to a node to expand it displaying the pods that are running on it.

What you will notice is that when you click on a node, or pod a property pane will be shown on the right hand side with the properties of the selected object. An example of a node is shown in the following screenshot.

Controllers
Click on the Controllers tab to see the health of the clusters controllers. Again here you will see CPU usage, memory working set, and memory RSS of each controller and what is running a controller. As an example shown in the following screenshot you can see the kubernetes dashboard pod running on the kubernetes-dashboard controller.

The properties of the kubernetes dashboard pod as shown in the following screenshot gives you information like the pod name, pod status, Uid, label and more.

You can drill in to see the container the pod was deployed using.
Containers
On the Containers tab is where all the containers in the AKS cluster are displayed. An as with the other tabs you can see CPU usage, memory working set, and memory RSS. You also will see status, the pod it is part of, the node its running on, its uptime and if it has had any restarts. In the following screenshot the CPU usage metric filter is used and I am showing a containers that has restarted 71 times indicating an issue with that container.

In the following screenshot the memory working set metric filter is shown.

You can also filter the containers that will be shown through using the searching by name filter.

You also can see a containers logs in the containers tab. To do this select a container to show its properties. Within the properties you can click on View container live logs (preview) as shown in the following screenshot or View container logs. Container log data is collected every three minutes. STDOUT and STDERR is the log output from each Docker container that is sent to Log Analytics.
Kube-system is not currently collected and sent to Log Analytics. If you are not familiar with Docker logs more information on STDOUT and STDERR can be found on this Docker logging article here: https://docs.docker.com/config/containers/logging.

