Recently the Operations Management Suite (OMS) team at Microsoft announced the private preview of Service Map in OMS formally known as Application Dependency Map. Service Map has been a long awaited feature in OMS. Service Map is a feature that is a part of OMS that discovers and maps Windows & Linux app and system dependencies. Service Map displays these dependencies in application maps within OMS. Service Map did not start with OMS. It actually started as a standalone product named Fact Finder and later was integrated with SCOM. The integration of FactFinder with SCOM allowed Bluestripe to automatically create Distributed Applications in SCOM. Well Microsoft acquired BlueStripe and the rest is history.
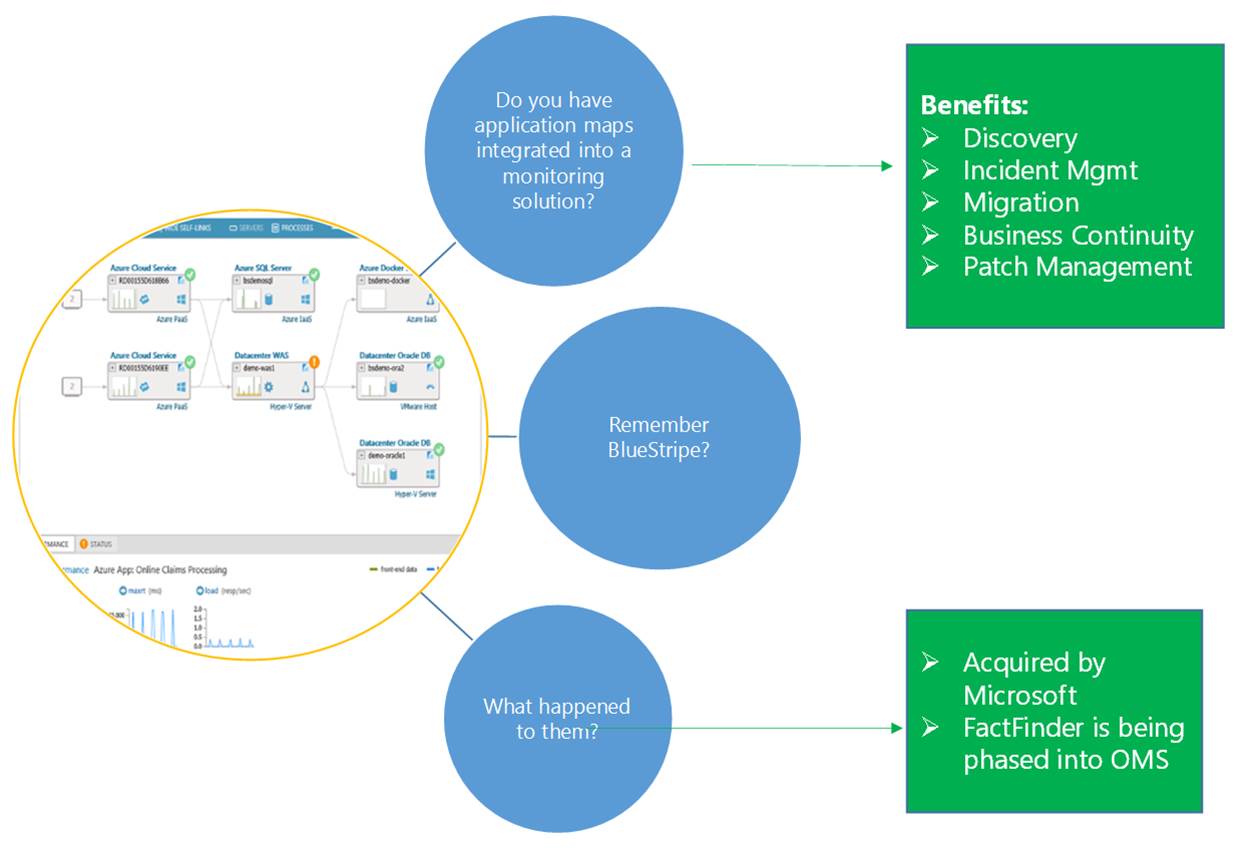
In this post I will set out to explore and break down Service Map, how it is installed, info about the agent, how it works, key points about it, how the data flows and more. NOTE: Click on any of the images in this post to display larger in a new window. Also this post is my first effort in taking one of my PowerPoint’s and converting into a post! The following graphic describes some of the benefits of having application maps including in your monitoring solutions along with information about FactFinder:
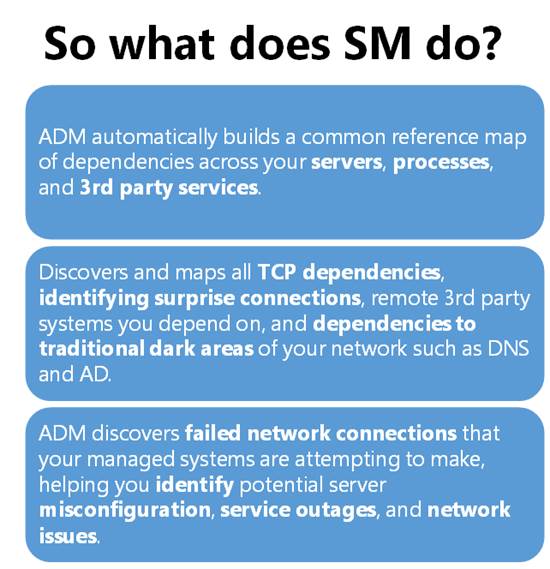
Now let’s take a look at what Service Map does and how it looks.
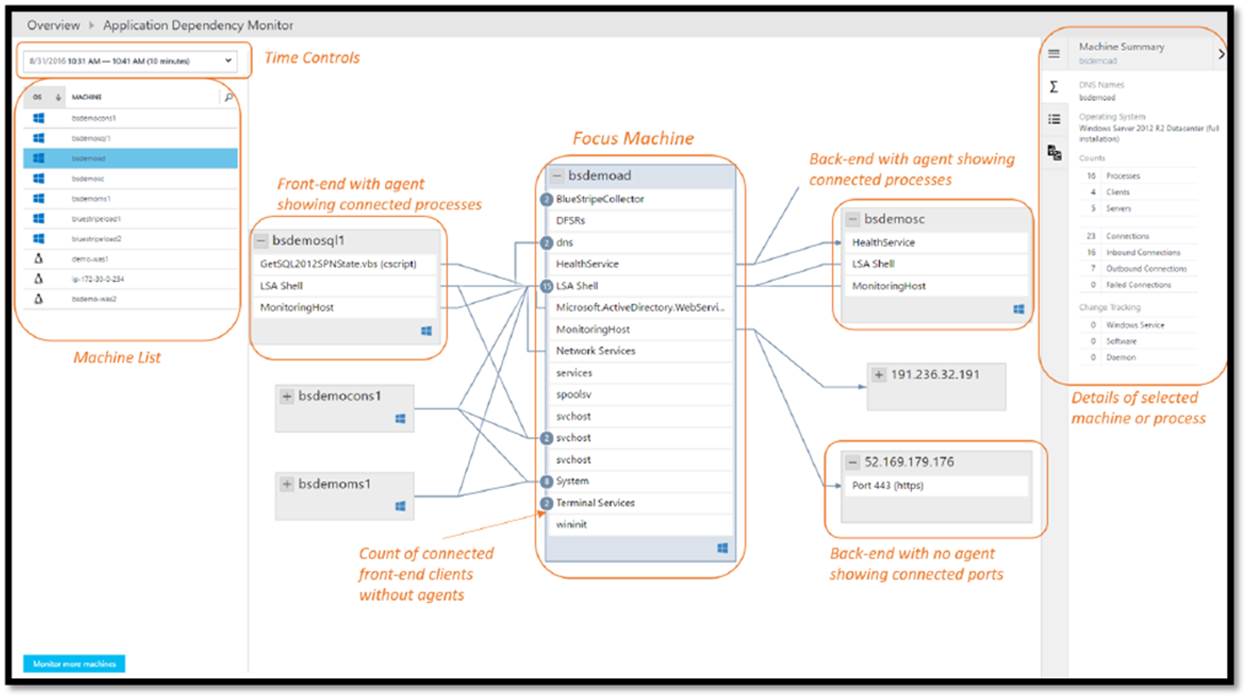
Now let’s take a look at one of the Service Maps aka Application Maps in OMS. Notice on the left hand side the breakdown of the interface. In Service Map there is a focus machine in the center. There are front end and back end connections into that focus machine. These are the dependencies flowing in and out of the focus machine giving the mappings. Notice on the left-hand side you can control the time controls and select either a Windows or Linux machine from the list. Finally, on the left-hand side are the details of the current selection. The current selection can be a machine or process.
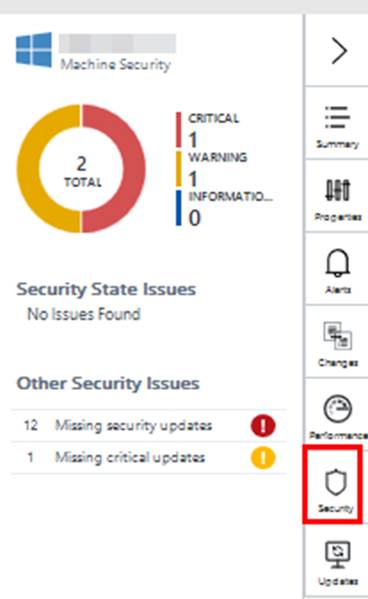
Also notice that SM integrates with Change Tracking, Alerts, Performance, Security, and updates. What this means is that when you have a focus machine selected you can click on the corresponding solution on the right hand. When you click on the solution i.e. updates or security the update or security dashboard widget will be shown and you can drill down from there for further detail.
A common question that comes up when discussion Service Map is how does it work. The following graphic displays the process from the solution add to the actual mapping within OMS.
Other key information about Service Map is detailed in the following graphics.
The next graphic looks at deploying the SM agent and locations for logs. The process is as simple as downloading and installing the agent from OMS.
Here is some more critical information you need to know about the SM agent.
This next graphic details how Service Map dependency data flows into OMS.
At this current time Service Map supported Operating Systems at this time are:
| Windows | Linux |
|
|
Service Map’s computer and process inventory data is available for search in OMS Log Analytics. This is very cool as the log analytics and searching capability in OMS is powerful and most important very FAST. Having application components, service dependencies, and supporting infrastructure configuration data at your fingertips through the log analytics gives you a powerful troubleshooting and forensics tool. I am sure over time the query capabilities will be expanded to include even more.
 |
 |
| Type=ServiceMapComputer_CL | Type=ServiceMapProcess_CL |
A few Service Map Log Analytic query examples:
List the physical memory capacity of all managed computers:
Type=ServiceMapComputer_CL | select TotalPhysicalMemory_d, ComputerName_s | Dedup ComputerName_s
List computer name, DNS, IP, and OS version:
Type=ServiceMapComputer_CL | select ComputerName_s, OperatingSystemVersion_s, DnsNames_s, IPv4s_s | dedup ComputerName_s
List Process Map by process name:
Type=ServiceMapProcess_CL (ProductName_s=TeamViewer)
Thanks for reading and I hope you enjoyed this post on OM’s Service Map. Now go out and add the public preview right away.


