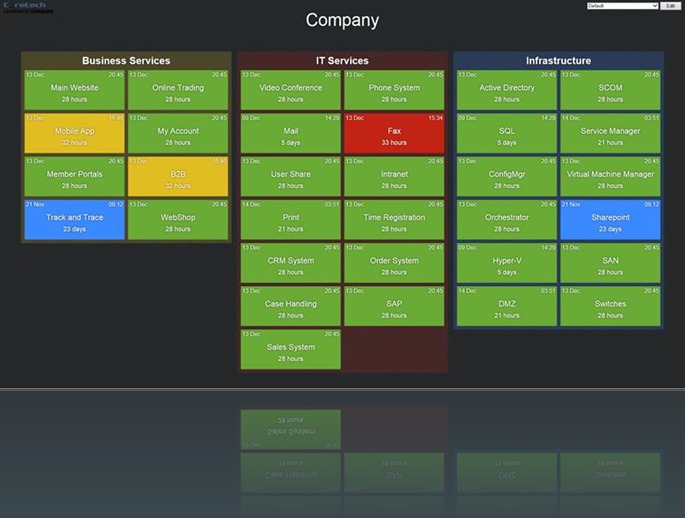
There is another cool solution from Coretech. Coretech has recently released a new Dashboard for SCOM 2012. This dashboard does a good job of presenting the health of your Business and IT Service in an easy to see format.
It gives you a single place to show the health of the Distributed Applications and the health state of any groups of objects. You have the ability to select what distributed applications and groups of objects you want to display.
This dashboard will also display when objects are in maintenance mode.
Clicking on one of the squares will open a diagram view of the distributed application in the SCOM
web console. This dashboard could be used for IT Managers that need instant visibility of the health of the environment,
NOC’s, Service Providers, or Service Desk teams that need to see health states of services.
Here is a link to check out a demo of it: http://dashboard.coretech.dk/
Here is a link to the product page: http://coretech.dk/products/dashboard-scom/
FAQ’s for the dashboard: http://blog.coretech.dk/dashboard/faq/


